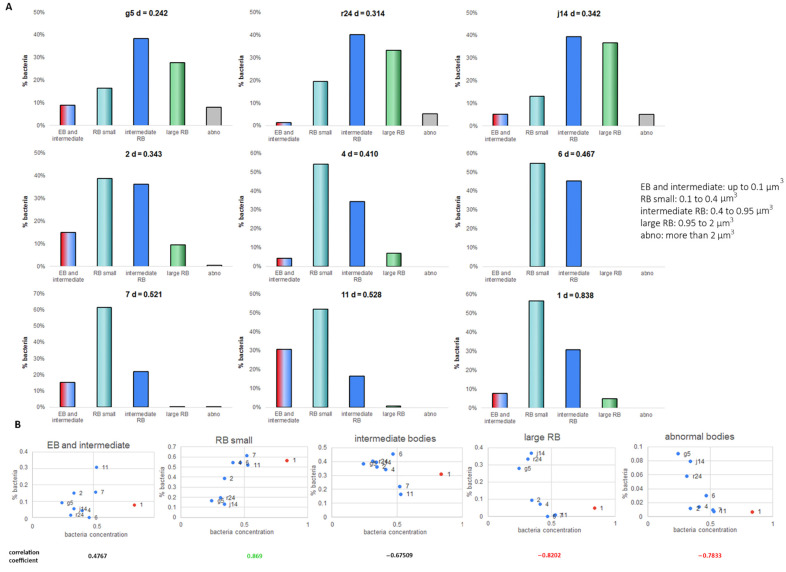
Figure 8.
Bacteria classes vary depending on the concentration of bacteria inside the inclusion. (A) To ease the analysis, the main classes have been grouped to present 4 main classes. EB: elementary body; RB: reticulate body; d: density. (B) Proportion of bacteria as function of the concentration of bacteria (bacteria per µm3). In red, inclusion 1 which is atypical. Pearson’s correlation coefficient (without inclusion 1): in black under arbitrary threshold of ±0.75, in green positive correlation above 0.75 and in red negative correlation below −0.75.

