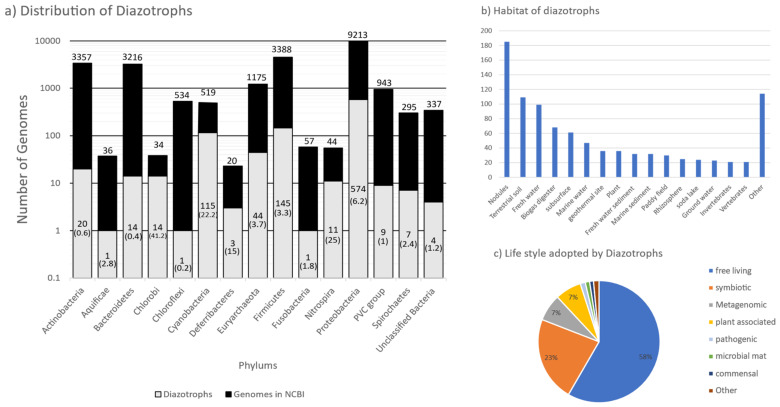
Figure 2.
Distribution, habitat, and lifestyle of diazotrophs in various bacterial and Archaeal phyla. (a) The black bar represents the total number of genomes sequenced, and the gray bar the total number of diazotrophs in that phylum. Labels on top of black bar indicate the total number of sequenced genomes. Labels in the gray bar represent the number of genomes containing NifHDKENB in that phylum (numbers in parentheses are the percentage of sequenced genomes that have NifHDKENB). (b) Distribution of organisms having all six nif genes by habitat and (c) pie diagram showing the lifestyle adopted by various diazotrophs.

