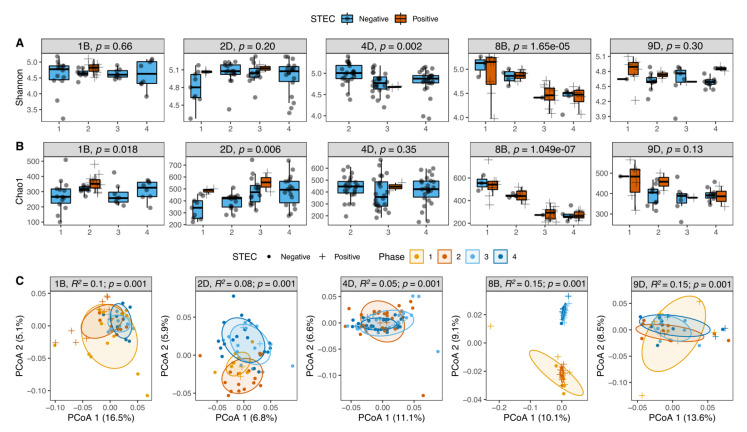
Figure 4.
Temporal dynamics in microbiota diversity among 59 cattle from five farms. Alpha diversity was compared using the (A) Shannon and (B) Chao1 indices by farm and sampling period. Each box represents a different farm with the numbers on the x-axis representing the four sampling visits; significant differences were detected using the Kruskal–Wallis test. (C) Beta diversity was also examined using a principal coordinate analysis (PCoA) of the weighted UniFrac distances; PERMANOVA results (R2 and p-value) were calculated. STEC shedders (+) and non-shedders (circles) were plotted by phase, which is represented by four different colors.

