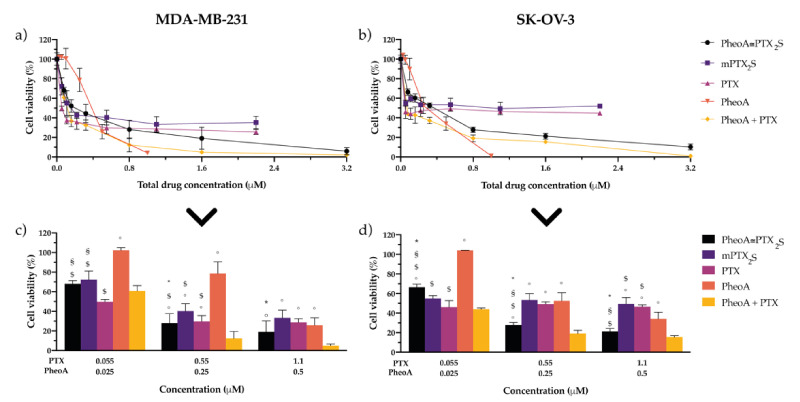
Figure 5.
In vitro combination therapy. Dose-response curves of (a) MDA-MB-231 or (b) SK-OV-3 cells incubated for 24 h with single drugs or their combination delivered free or in nanoparticles and irradiated with 1 J/cm2 of light; after an additional 24 h in drug-free medium, cell viability was measured by MTS assay. Total drug concentration is referred to PTX + PheoA concentration. Data are expressed as mean percentage ±SD of at least three independent experiments, carried out in triplicate. To better compare the cytotoxic effects of the different drug formulations, some concentrations have been extrapolated: panel (c) for MDA-MB-231, and panel (d) for SK-OV-3 cells. Statistical significance was calculated applying the ANOVA Two-way with Bonferroni’s correction: * significantly different from mPTX2S; § significantly different from PTX; $ significantly different from PheoA; ° significantly different from PheoA + PTX.

