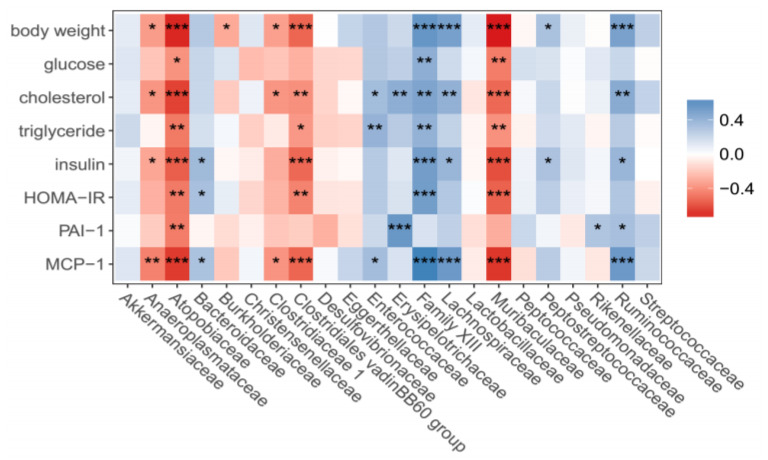
Figure 8.
Correlation heat map of relative abundance of gut microbiota, at the family level, with physiological and biochemical parameters. The experimental regimen is described in the legend of Figure 4. *, **, ***: p < 0.05 or 0.01 or 0.001 in positive (blue) or negative (red) correlations between the abundance of each gut family bacteria and physiological or biochemical variables in the mice (n = 40).

