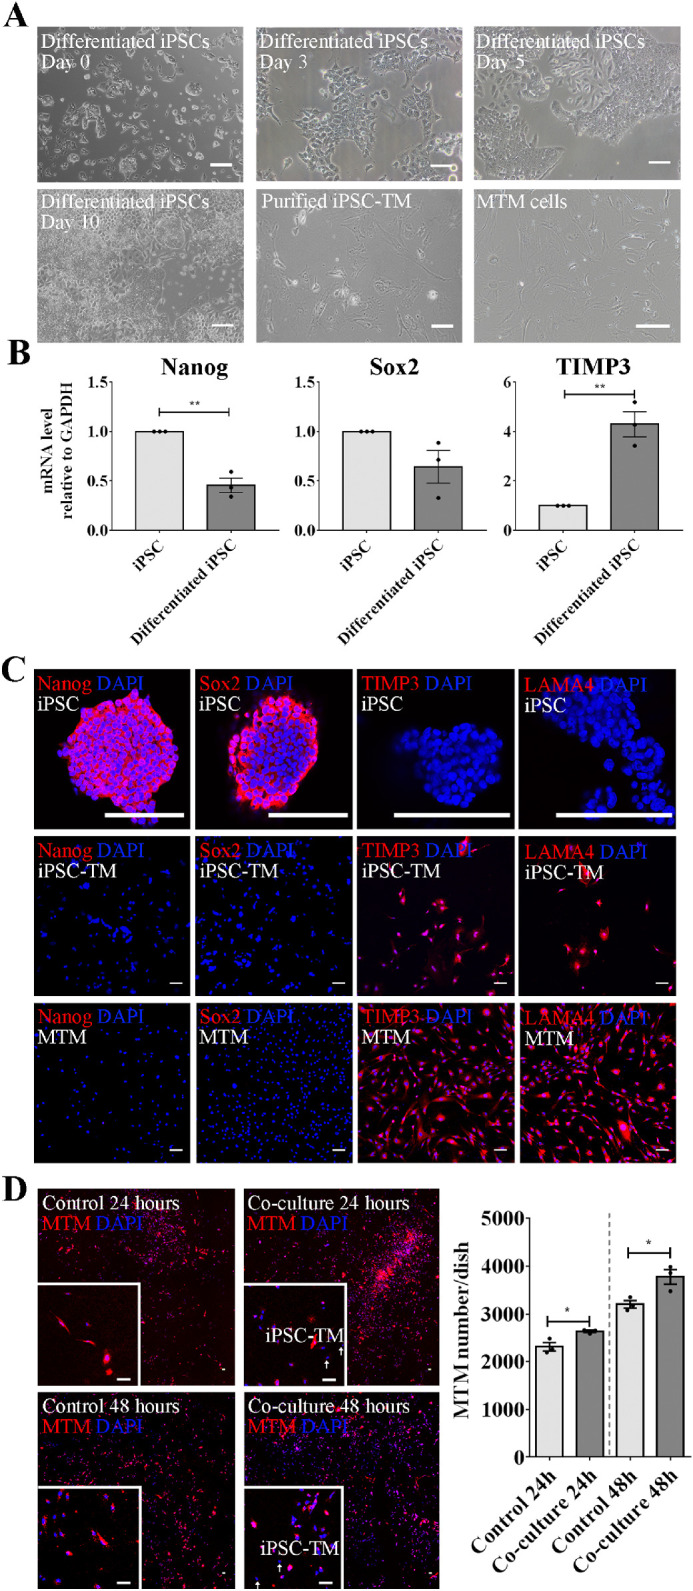
Figure 1.

Coculture with iPSC-TM stimulates MTM cell division. (A) Morphology of undifferentiated iPSCs (day 0), iPSC-TM after differentiation for 3, 5, 10 days, as well as purified iPSC-TM and MTM cells. In comparison with iPSC colonies, differentiated cells display a spindle-like shape similar to MTM cells and exhibit TM features, including expression of TM biomarkers and dexamethasone-inducible myocilin expression. (B) Relative mRNA levels of Nanog and Sox2 are higher in undifferentiated iPSC than in those differentiated for 10 days, whereas TIMP3 showed a significantly higher expression in the differentiated cells (n = 3). GAPDH was used as the reference gene. (C) Immunohistochemical staining of Sox2 (red), Nanog (red), TIMP3 (red), and LAMA4 (red) in undifferentiated iPSC, iPSC-TM, and MTM. Nuclei are labeled with DAPI (blue). Typical results from n = 3 technical repeats are shown. (D) Left panel: The 40× magnification images of MTM cells labeled with CellTracker Red CMTPX cocultured with iPSC-TM for 24 and 48 hours. Nuclei are labeled with DAPI (blue). The region in the white frame shows a magnified view. Typical results from n = 3 technical repeats are shown. Right panel: Quantification of MTM cells (red) in the control and cocultured groups after 24 and 48 hours. Purified iPSC-TM cells significantly stimulate MTM division, both after 24 hours and 48 hours coculture. *P < 0.05, **P < 0.01 by two-tailed t-test. Scale bar = 100 µm. Data shown represent means ± SEM.
