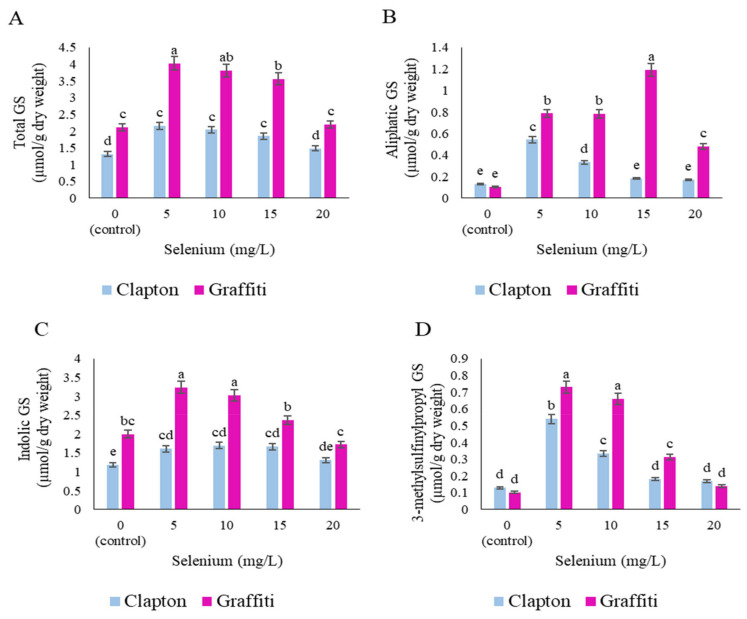
Figure 2.
Mean comparison of sodium selenate treatments on glucosinolate (GS) of cauliflower leaves (“Clapton, “Graffiti”). (A) Total GS, (B) Aliphatic glucosinolates, (C) Indolic glucosinolates, (D) 3-methylsulfinyl-propyl GS, (E) 4-methoxyindol-3-ylmethyl GS, (F) 4-methylsulfinylbutyl GS, (G) indol-3-ylmethyl GS, (H) 1-methoxyindol-3-ylmethyl GS and (I) 4-hydroxy-indol-3-ylmethyl GS. Shown are the mean ± standard deviations of three replicates. Bars marked by the same letter are not significantly different (p ≤ 0.05, Duncan’s multiple range tests).


