Figure 5.
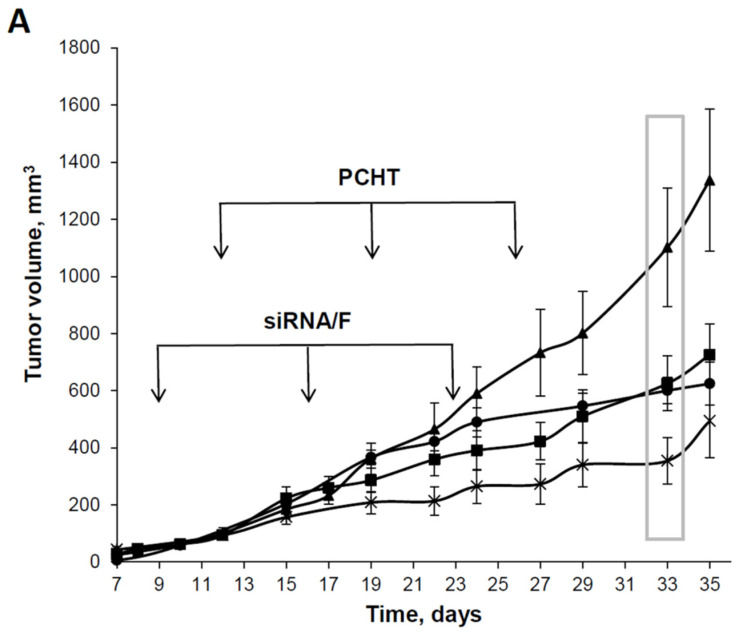
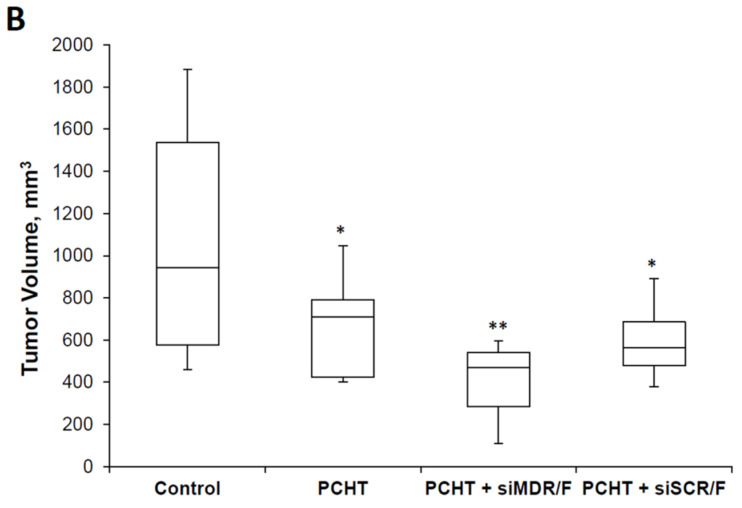
The effect of siMDR/F lipoplexes and polychemotherapy (PCHT) on KB-8-5 human xenograft tumors in SCID mice. The mice received treatment according to the experimental setup (Figure 1). (A) Dynamics of tumor growth. The days of siMDR/F or PCHT treatment are shown by arrows. The data represent the mean ± standard error of the mean. PCHT alone (-■-), siMDR/F and PCHT (-×-), siSCR/F and PCHT (-•-), and control, untreated mice (-▲-). (B) Tumor volumes on day 33 after tumor implantation (boxed in A). The data were processed using the STATISTICA program, using one-way analysis of variance followed by post hoc analysis (Fisher’s test). The data represent the median, the boxes show the variations between the 25% and 75% percentiles, and the whiskers show the non-outlier range. Statistically significant differences between the control group and other groups (PCHT and PCHT/siMFR/F) are indicated by asterisks (* p < 0.05; ** p < 0.005).


