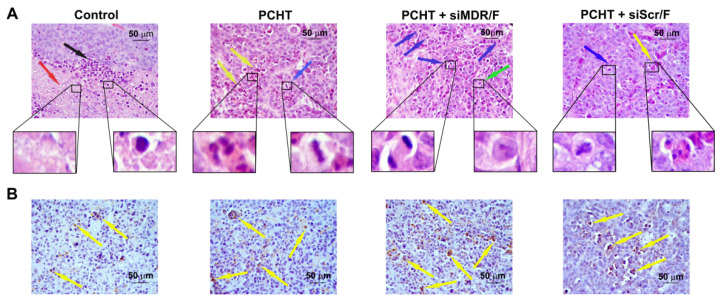
Figure 6.
Histopathological analysis of KB-8-5 tumor tissue from SCID mice without treatment (control), after polychemotherapy (PCHT), after PCHT combined with siMDR/F treatment (PCHT + siMDR/F) and after PCHT combined with siScr/F treatment (PCHT + siScr/F). (A) Tumor sections stained with hematoxylin and eosin. (B) Tumor sections stained with an anti-caspase-3 monoclonal antibody. The infiltration of tumor tissue by inflammatory cells is indicated by the black arrow. Necrotic tumor tissue is indicated by the red arrow. Apoptotic tumor cells are indicated by the yellow arrows. Mitoses are indicated by the blue arrows. Normal tumor cells are indicated by the green arrow. The total magnification is 400×.

