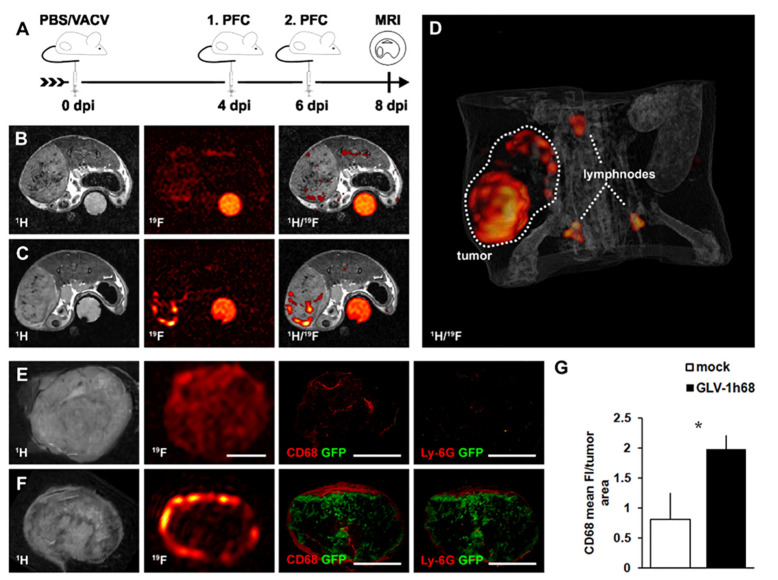
Figure 5.
Visualization of viral colonization within tumors by 19F MRI. (A) Timeline-1936-MEL melanoma-bearing, athymic nude mice were injected i.v. with virus (1 × 10⁷ pfu of GLV-1h68) or PBS as a control. Emulsified PFC was administered i.v. on days 4 and 6 post virus injection, followed by 19F MRI 48 h later. (B,C) Representative 1H, 19F and overlaid 1H/19F in vivo images of a mock-infected, tumor-bearing mouse (B), showing a low 19F signal throughout the tumor tissue; and a GLV-1h68-infected, tumor-bearing mouse (C), exhibiting intense 19F signal accumulation along the tumor rim. (D) 3D 1H/19F overlay reconstruction of the abdomen of a GLV-1h68-infected mouse clearly showed the accumulation of PFC in the tumor and adjacent lymph nodes. (E,F) Representative ex vivo 1H, 19F images together with corresponding histology (CD68, Ly-6G), showing the distribution of the CD68+-macrophage/Ly-6G+-neutrophil population and the 19F signal of a mock-infected tumor (E) and a GLV-1h68-infected tumor (F). (G) Quantitative analysis of CD68-fluorescence intensity (FI) of GLV-1h68-colonized tumors show a marked increase over mock-infected control tumors. * p < 0.05; Students t test. Figure reproduced from ref. [36].

