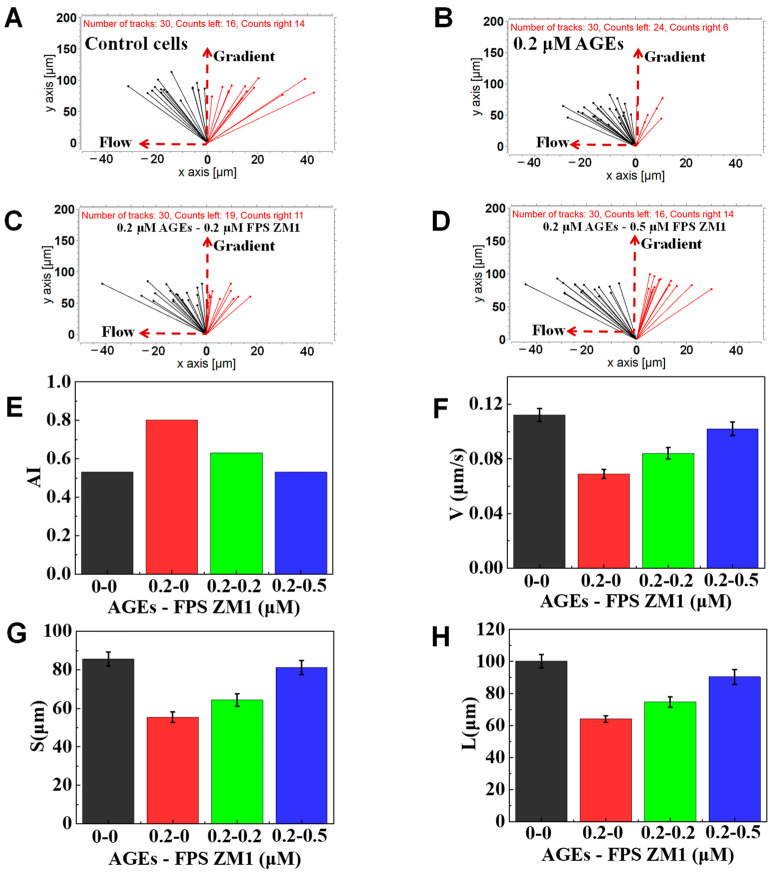
Figure 8.
Chemotaxis of AGEs, FPS ZM1, and their mixture-treated test cells in 100 nM of fMLP gradient. (A) The connecting line between the initial position and the end position of normal cells. (B) The connecting line between the initial and end position of cells pretreated with 0.2 μM AGEs and 0 μM FPS ZM1. (C) The connecting line between the initial and end position of cells pretreated with 0.2 μM AGEs and 0.2 μM FPS ZM1. (D) The connecting line between the initial and end position of cells pretreated with 0.2 μM AGEs and 0.5 μM FPS ZM1 pretreated cells. (E–H) Comparison of quantitative cell migration parameters including drifting index (AI), cell velocity (V), the displacement along the gradient (S), and the whole movement distance (L).

