Figure 5.

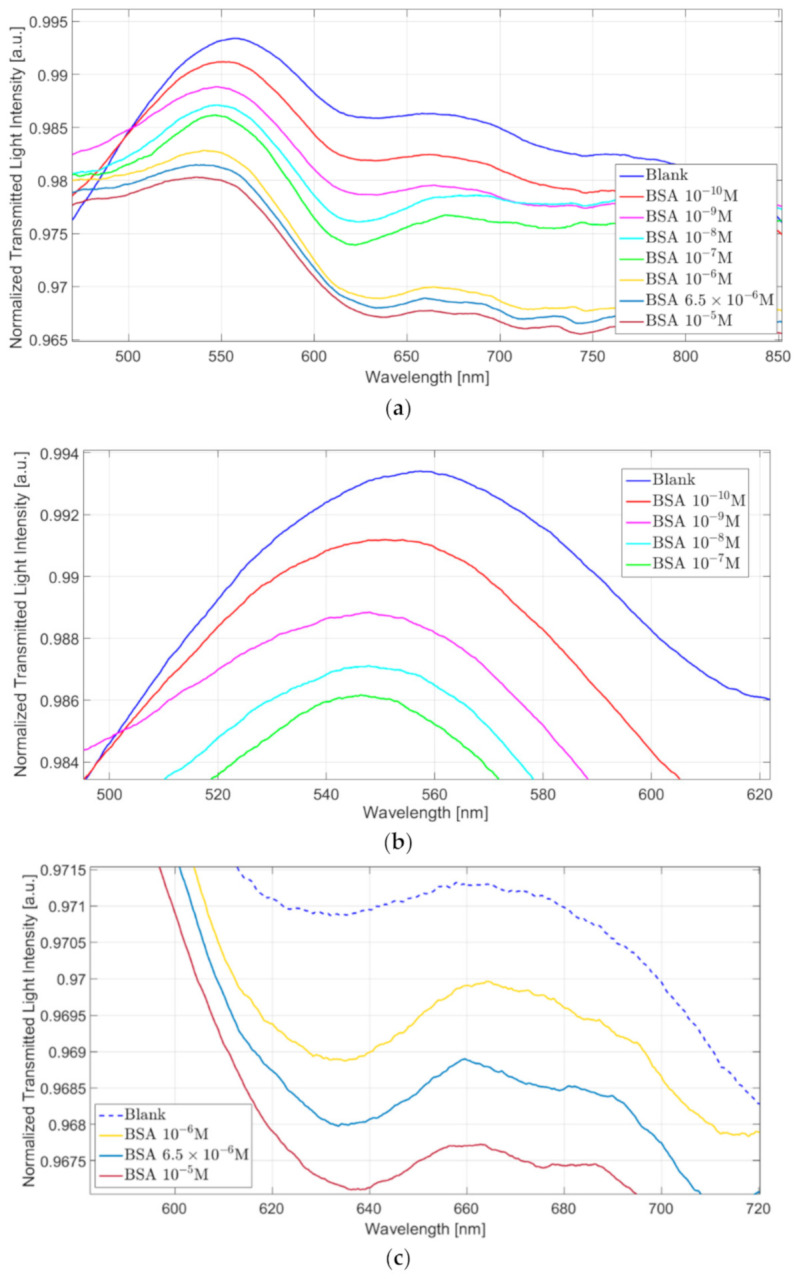
(a) Plasmonic spectra at varying of the BSA concentration (0–10−5 M) relative to “GNG-based longitudinal” configuration. Zoom of the resonance wavelength area relative to (b) peak at 550 nm and (c) peak at 630 nm.

(a) Plasmonic spectra at varying of the BSA concentration (0–10−5 M) relative to “GNG-based longitudinal” configuration. Zoom of the resonance wavelength area relative to (b) peak at 550 nm and (c) peak at 630 nm.