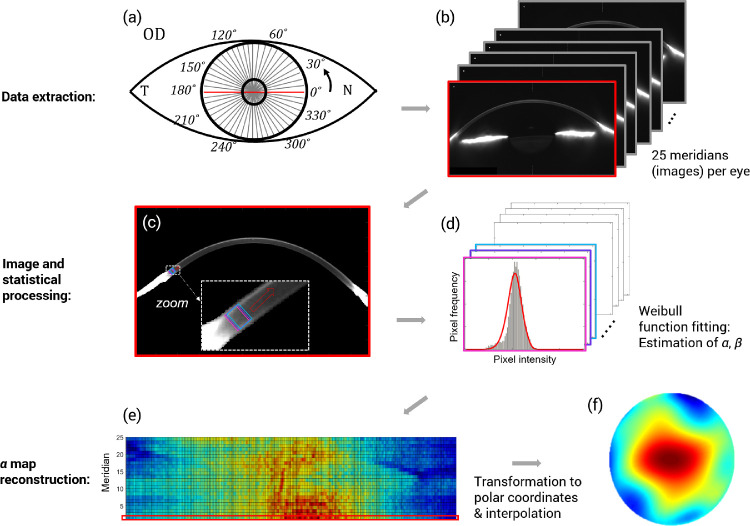
Figure 1.
Main steps to obtain a corneal α parameter map from each Scheimpflug measurement. Diagram illustrates, using gray lines, the 25 meridians imaged by the Pentacam HR rotating camera (a) and the corresponding 25 images (b). The horizontal meridian is marked in red (a, b) as an example. After data extraction, each image is analyzed individually, first by segmenting the cornea and applying a moving ROI (c). For illustrative purposes, only the first three ROIs are shown with different colors along with a red arrow that indicates the continuity of the process across the segmented cornea (c). Second, the corresponding collection of histograms representing the pixel intensity distribution in each ROI are built (d). The probability density function (PDF) of the Weibull function is represented by the red line and fitted to the pixels in each ROI. The fit is performed by estimating the two parameters of the Weibull distribution (α and β), using the method of maximum likelihood (d). Finally, to construct a corneal α parameter map, the α values obtained from each frame in standard Cartesian coordinates (e) must be transformed to polar coordinates and interpolated to reach the final map (f). For illustrative purposes, the red rectangle in (e) indicates the α values corresponding to the first frame in (b) and the horizontal meridian in (a).

