Figure 7.

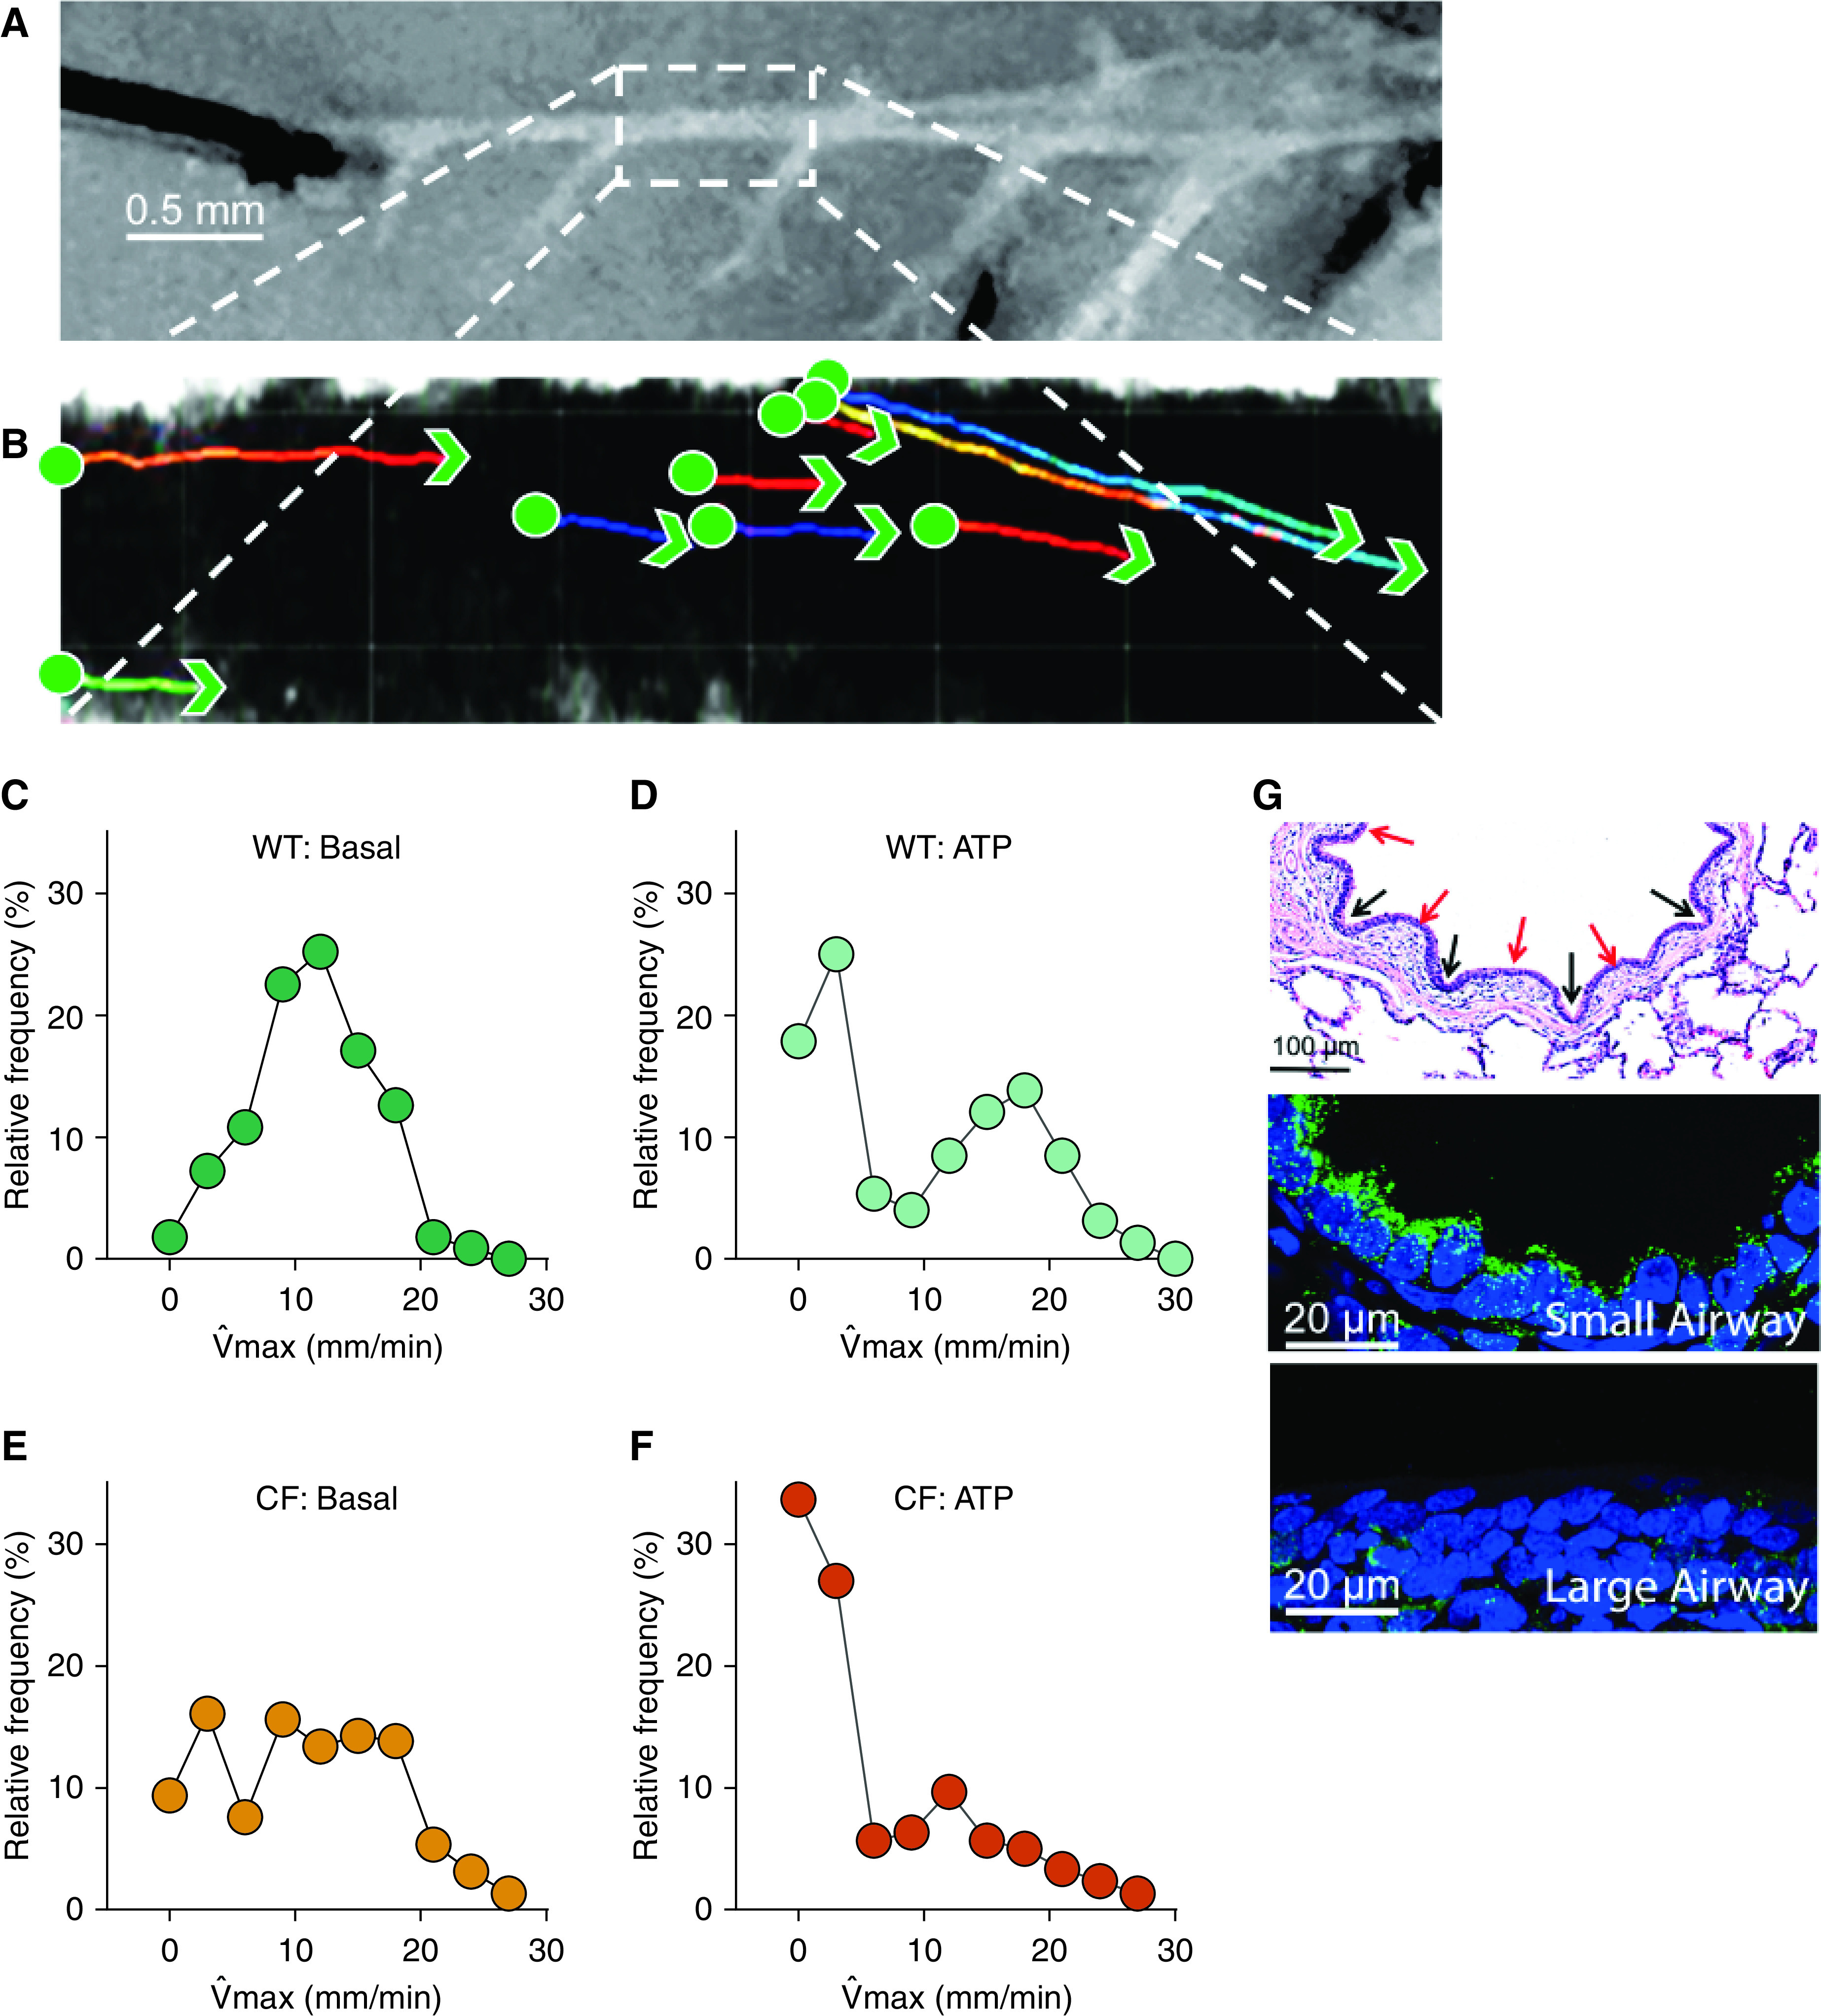
The CF Sm airway is defective in mucociliary transport. (A and B) Representative experiment showing a histogram from pooled data of three non-CF pigs and three CF pigs. (A) The particles are moving across the surface of the Sm airway. Scale bar, 0.5 mm. Sm airways were removed from newborn pigs and maintained in solution ex vivo, cut longitudinally, and pinned to a dish layered with dental wax. (B) Red fluorescent carboxylate–modified microspheres (1-μm diameter FluoSpheres, Molecular Probes) were added, and particle movement was visually tracked by 25× objective and video confocal microscopy (1 frame per second [fps]). To stimulate mucin secretion, the tissue preparation was incubated with 1 mM ATP for 30 minutes. (C–F) The maximum speed distribution, under each condition, was plotted using Prism software. Green circles represent non-CF samples, and orange circles represent CF samples. (G) Hematoxylin and eosin stain of a Sm airway from a non-CF pig (top). The image shows mucosal furrows (black arrows) and ridges (red arrows). Scale bar, 100 μm. Immunofluorescence for ATP6V0D2 (green) and nuclei (blue) in Sm airway epithelia (middle panel) and Lg airway epithelia (bottom panel). Scale bars, 20 μm. max = maximal velocity.
