Figure 2.
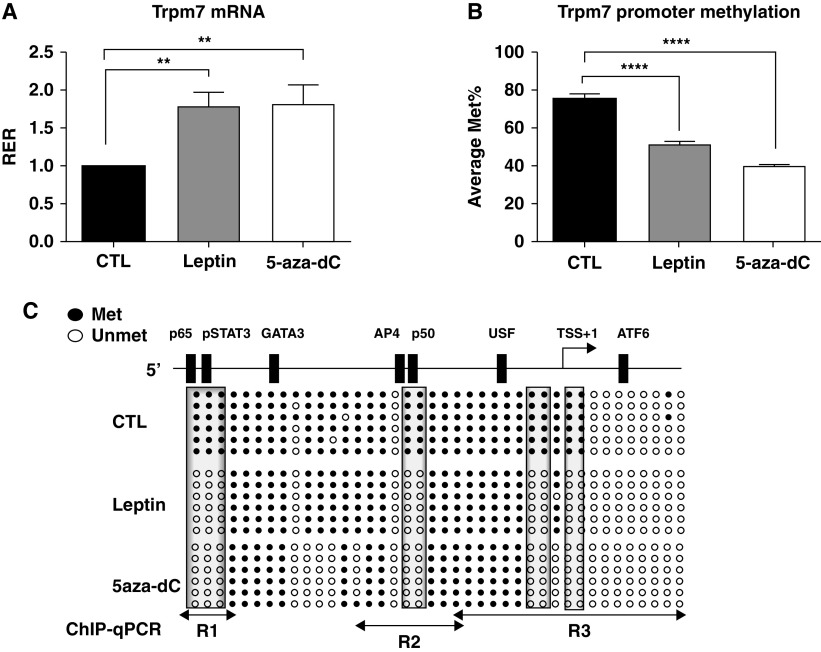
Leptin increased the Trpm7 mRNA level and demethylated the Trpm7 promoter. PC12LEPRb cells were treated with 1 ng/ml leptin or 0.5 μM 5-aza-dC for 3 days and were subjected to gene expression and DNA methylation analysis. (A) mRNA levels of Trpm7 assayed by using quantitative PCR (qPCR). (B) Average values of Met% were determined by using bisulfite sequencing. (C) Schematic diagram of the 5′ promoter region of Trpm7. In silico analysis identified putative transcription factor binding sites at the Trpm7 promoter. The methylation status of individual CpG sites at the Trpm7 promoter was analyzed by using bisulfite sequencing. Unmethylated (open circles) or methylated (solid circles) CpG sites are indicated. Each row of circles represents an individual clone sequenced. The boxed area illustrates the specific CpG sites showing differential methylation as compared with vehicle CTLs. Results shown in A and B are expressed as the mean ± SEM. An ordinary one-way ANOVA with Tukey multiple comparisons was used to determine the significant differences between groups. **P < 0.01 and ****P < 0.0001 compared with CTL. The qPCR-amplified regions for the chromatin IP assay (ChIP) for the Region 1 (R1) through R3 regions (data shown in Figures 3–4) are indicated by lines. 5-aza-dC = 5-Aza-2′-deoxycytidine; ATF6 = activating transcription factor 6; GATA3 = GATA binding protein 3; Met% = Trpm7 promoter methylation; p50 = NF-κB p50 subunit; p65 = NF-κB p65 subunit; pSTAT3 = phosphorylated STAT3; RER = relative expression ratio; STAT3 = signal transducer and activator of transcription 3; TSS = transcription start site; USF = upstream stimulatory factor.

