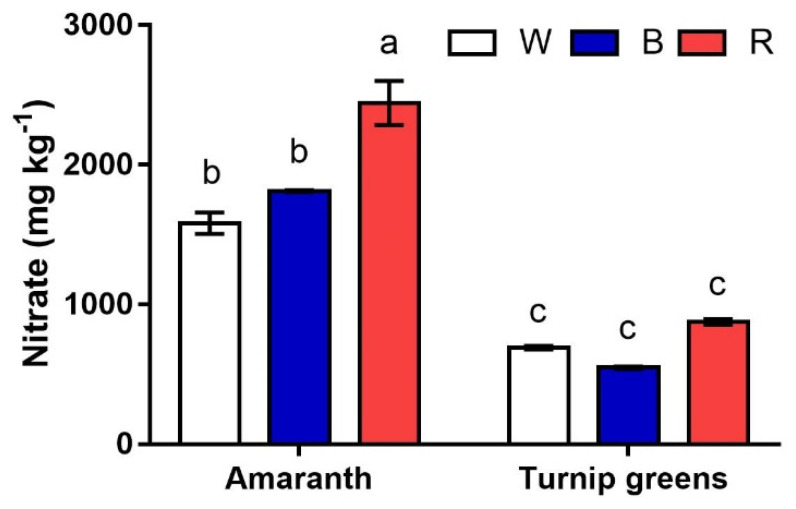
Figure 4.
Interaction effect of species × light treatment (W = white, B = blue, R = red) on the nitrate content (ppm) of microgreens. Data are means ± standard error (n = 3). Three biological replicates were used for the analysis. Different letters indicate significance at p ≤ 0.05 according to Tukey’s test.

