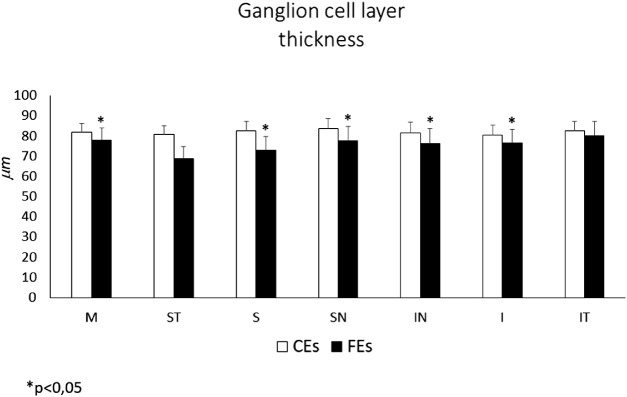
Figure 4.
Histograms showing mean ganglion cell layer (GCL) thickness (expressed in micron) in FEs and CEs. GCL thickness according to the elliptical 2.4 × 2.0 mm annulus area are divided in 6 radial sectors: superior (S); superonasal (SN); inferonasal (IN); inferior (I); inferotemporal (IT); and superotemporal (ST; see Fig. 2B). The mean GCL thickness (M) in FEs is significantly reduced as compared to CEs. Subfield analysis shows in FEs a significant thinning in all sectors (S, SN, IN, and I), except for the temporal ones (ST and IT). Data are presented as mean ± SD, FEs n = 39, and CEs n = 30. 1-way ANOVA, *P < 0.05.

