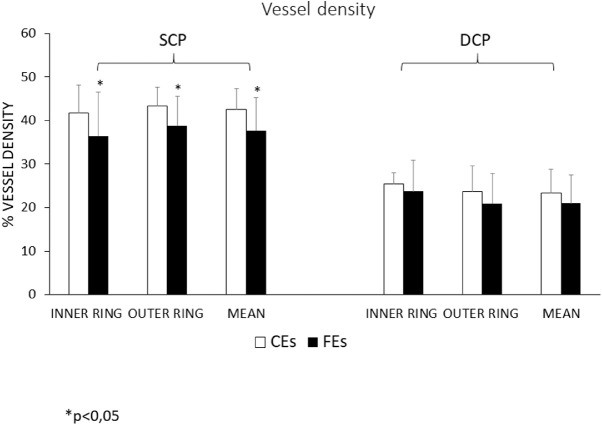
Figure 5.
Histograms showing vessel density (VD) according to the 6 mm ETDRS sectors in superficial capillary plexus (SCP) (A) and deep capillary plexus (DCP) (B) in FEs and CEs. Data are shown as percentage VD. A VD is significantly reduced in FEs as compared to CEs in the whole ETDRS area (Mean) and in the inner and outer ring. B VD is reduced in FEs, as compared to CEs, in all sectors, although not reaching a statistical significance. Data are shown as mean ± SD, FEs n = 25, and CEs n = 30. 1-way ANOVA, *P < 0.05.

