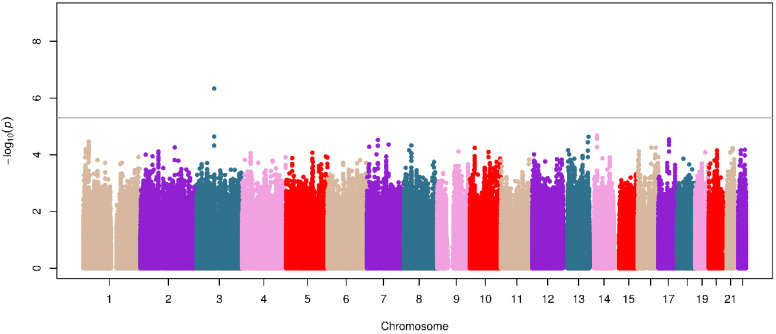
Figure 1.
Manhattan plot of association results of the change in FEV1 after ICS treatment in SLOVENIA. The logarithmic transformation of the p-value (−log10 p-value) is represented on the y-axis, along with the chromosome position (x-axis). The gray line indicates the suggestive significance threshold (p ≤ 5 × 10⁻⁶) considered for evidence of association with ICS response.

