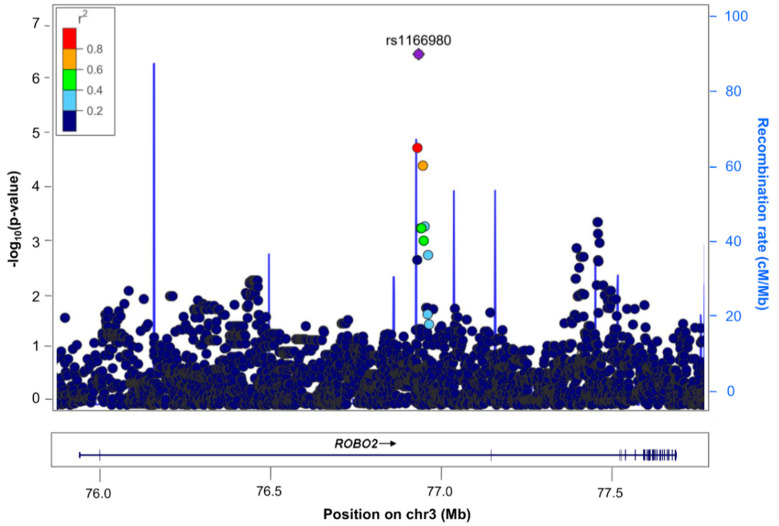
Figure 2.
Regional plot of association results with the change in FEV1 after ICS treatment expressed as a binary variable in SLOVENIA. Results are represented based on the significance of the association on the y-axis (−log10 p-value) and chromosome position (x-axis) for each SNP as a dot. The SNP rs1166980 suggestively associated with ICS response is represented by the purple diamond. The remaining SNPs are color-coded based on pairwise linkage disequilibrium (r2 values) with that SNP for European populations from 1KGP (GRCh37/hg19 build).

