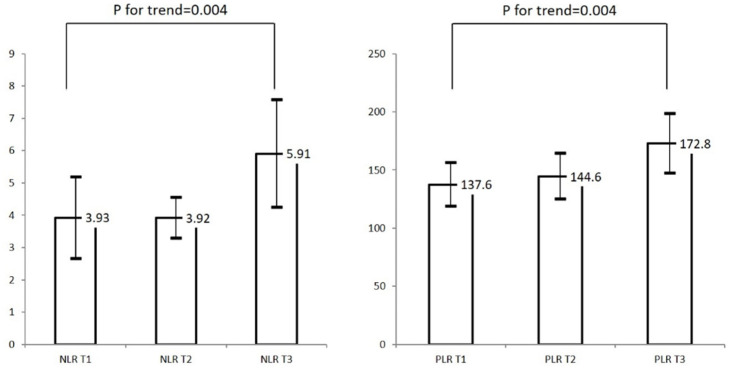
Figure 1.
Distribution of final infarct volume according to tertile of NLR and PLR. Abbreviations: NLR, neutrophil-to-lymphocyte ratio; PLR, platelet-to-lymphocyte ratio; T1, lowest tertile; T2, middle tertile; T3, highest tertile. Range of tertiles: NLR T1 (0.30–1.88), NLR T2 (1.90–4.15), NLR T3 (4.15–54.75); PLR T1 (24.5–94.1), PLR T2 (94.2–157.2), PLR T3 (158.6–754.4).

