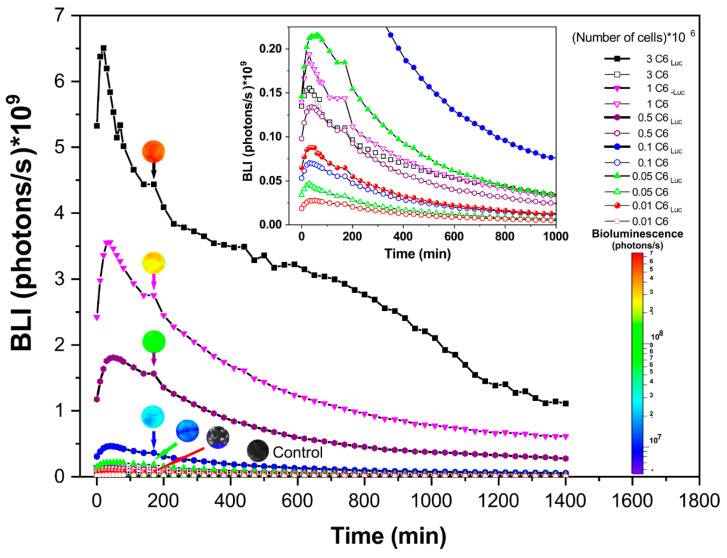
Figure 3.
Bioluminescent Kinetics of the C6Luc according to cell concentrations (represented by lines with solid symbols) and the respective controls (represented by lines with empty symbols). The inside figure shows the BLI signal inferior of 0.20 × 10⁹ photons/s. The BLI signal intensity was represented by color score bar (inferior right corner) and the correspondent BLI intensity of the C6Luc cells concentrations and control were represented using a ROI at 180 min.

