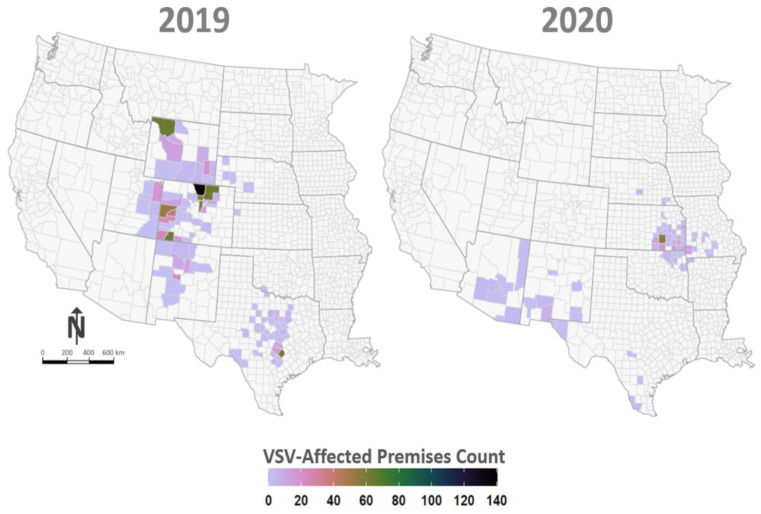
Figure 1.
VSV-affected premises maps. Figure depicts the geographic location and number of VSV-affected premises by U.S. County. Panel at left displays VSV-affected counties documented in 2019 and panel at right shows counties recorded in 2020. Counties are color coded according to legend at bottom with darker tones (green colors) indicating relatively higher numbers of VSV-affected premises.

