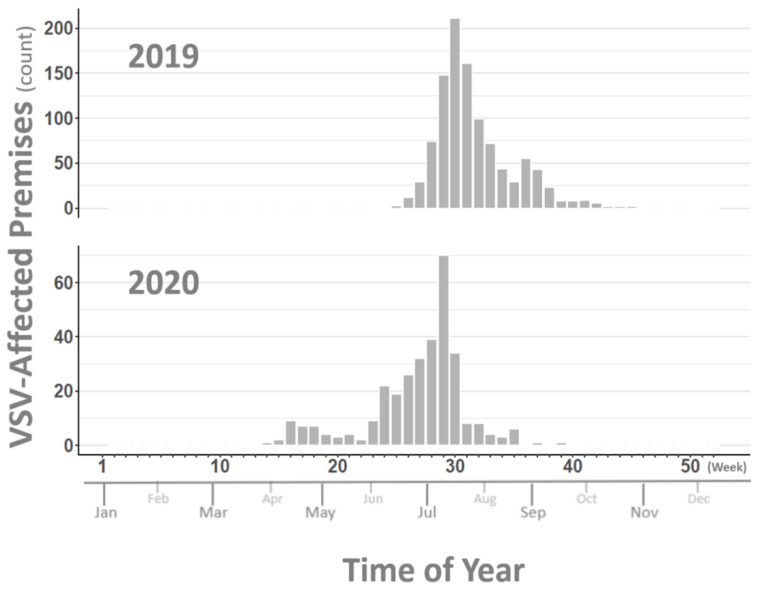
Figure 2.
Count of VSV-affected premises by week of reported lesion onset for 2019 and 2020. Vertical axes at right correspond to bar height and describe the number of premises reporting VSV lesion onset. Major horizontal axis lists week of year (Weeks 1–52) with approximate month of year displayed along minor horizontal axis. Top panel represents premises counts for the year 2019 and bottom panel provides those for 2020.

