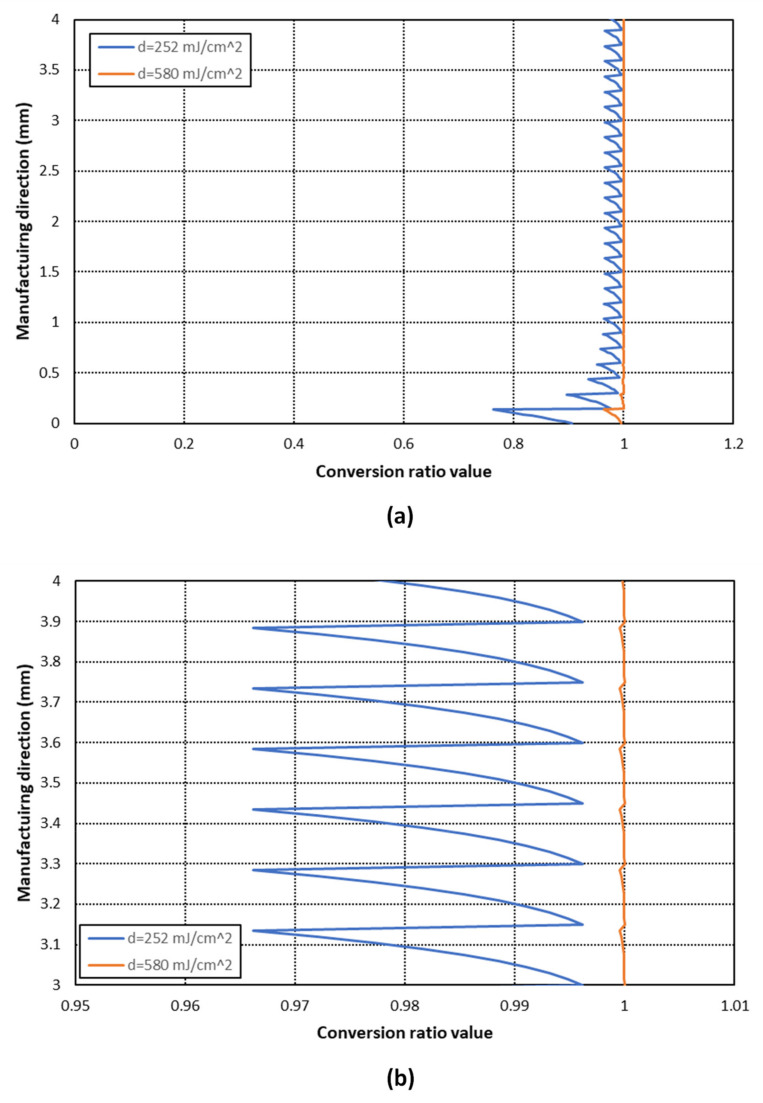
Figure 15.
Comparison of conversion ratio distribution along the manufacturing direction for the photocurable material with a 10% SL and a layer thickness of 150 μm according to the energy exposure dose. (a) It can be observed that a large difference is found in the last printed layers (b) Detail of conversion ratio values excluding the last printed layers.

