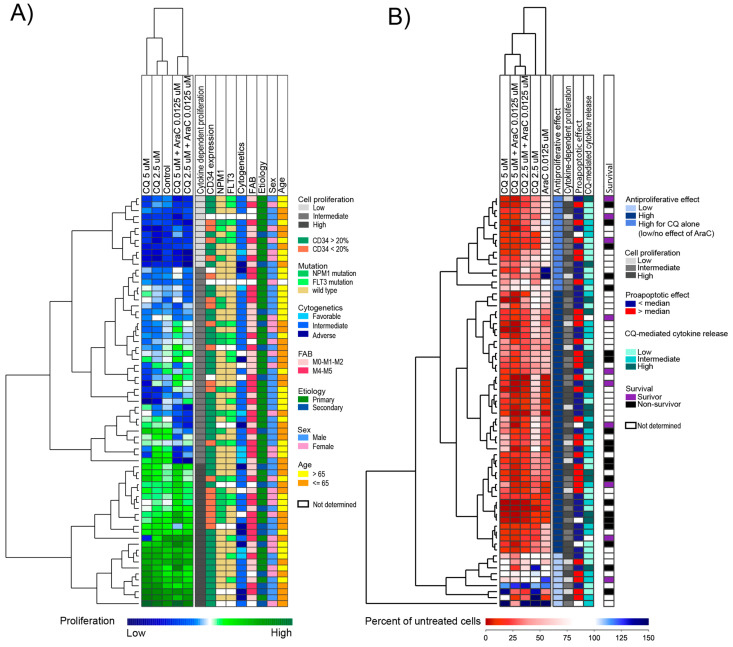
Figure 4.
An unsupervised hierarchical cluster analysis based on the effect of chloroquine and cytarabine/AraC on AML cell proliferation. AML cells from 81 consecutive patients were cultured for seven days with chloroquine (CQ 2.5 and 5 µM), AraC (0.0125 µM), chloroquine in combination with AraC or medium alone (control). Proliferation was measured using a 3H-thymidine incorporation assay. Detectable proliferation was defined as >1000 cpm, and results are presented for the 69 patients with detectable proliferation in untreated cultures. (A) The figure illustrates the cytokine-dependent AML cell proliferation for the untreated controls and drug-treated cultures (chloroquine or a combination of drugs) after results were normalized to the corresponding median for each group. The cluster could be divided into three main subsets based on the degree of proliferation as illustrated in the first column to the right: (i) low proliferation (upper cluster, light gray), (ii) intermediate proliferation (middle, gray), and (iii) high proliferation (lower cluster, dark gray). The figure also shows the distribution of biological and clinical characteristics for each individual patient (columns on the right part of the figure). (B) The figure shows the relative AML cell proliferation (i.e., percent proliferation compared to untreated controls) for the 69 AML patients after treatment with chloroquine and AraC. As shown, the majority of patients had a strong inhibitory effect of chloroquine, AraC or both drugs (two top subclusters, shown as blue and dark blue in the column to the right). A small subcluster of nine patients (bottom subcluster, shown as light blue in the column to the right) had mainly little or no effect of these treatments at the tested concentrations. Shown in different columns to the right of the figure are different patient subsets based on clustering of cytokine-dependent proliferation (patient classification as indicated in Figure 4A), proapoptotic effects (classified based on Figure 5, see Section 3.8), chloroquine-mediated cytokine release (based on Figure 6, see Section 3.9), and survival after completed intensive treatment. Survival is presented only for patients who completed the planned intensive and consolidation treatment, and all patients classified as survivors were observed for at least three years after treatment.

