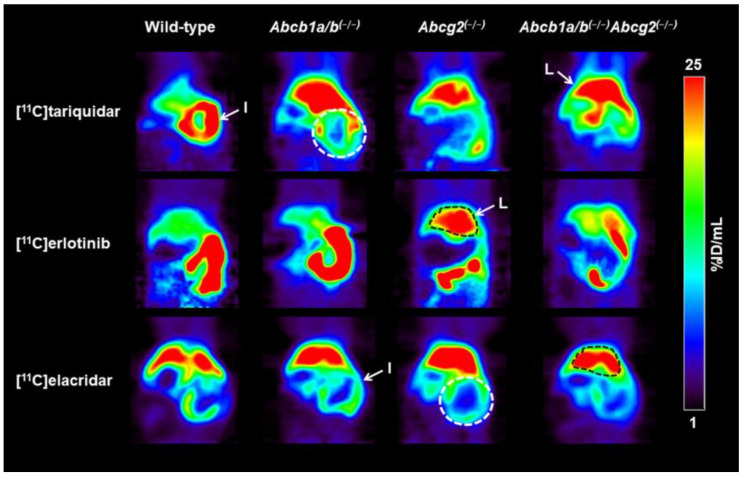
Figure 4.
Coronal PET summation images (0–60 min) of the abdominal region obtained after i.v. injection of either [11C]tariquidar, [11C]erlotinib, or [11C]elacridar in one representative wild-type, Abcb1a/b(−/−), Abcg2(−/−), and Abcb1a/b(−/−)Abcg2(−/−) mouse. Radioactivity concentration is expressed as percent of injected dose per milliliter (%ID/mL). Anatomical structures are labeled with white arrows and colored dashed-line areas (I: intestine, white; L: liver, black).

