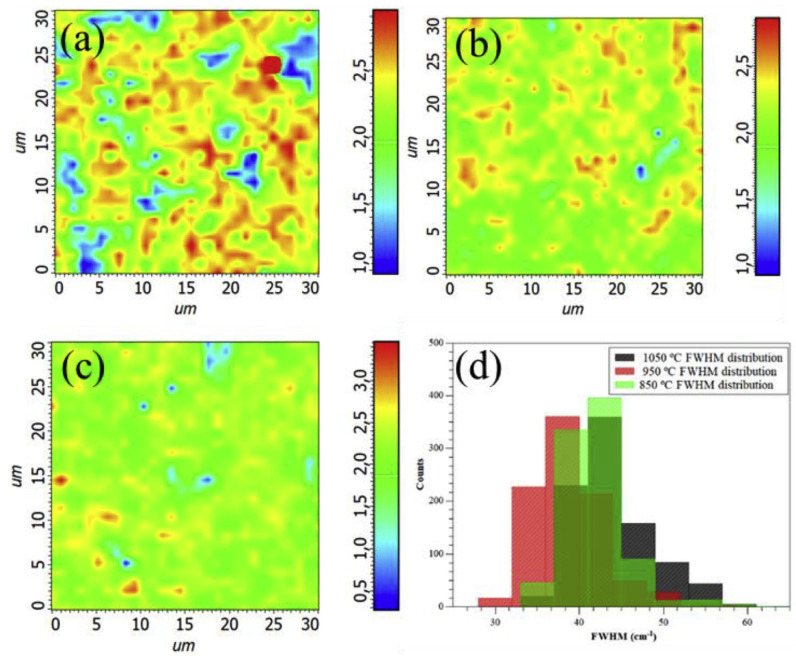
Figure 11.
Raman maps used for determining graphene layer numbers in flake samples prepared at different temperatures (a) 850 °C, (b) 950 °C, or (c) 1050 °C. (d) Histograms of 2D-band of samples prepared at different temperatures (reproduced with permission from ref. [82], Copyright 2018, Elsevier).

