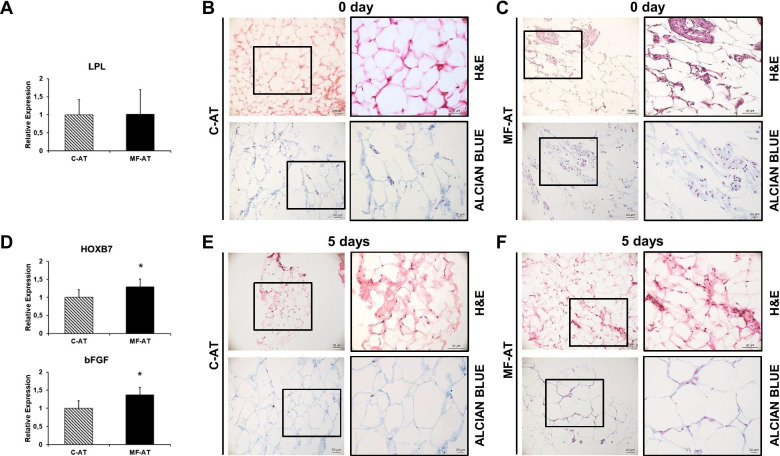
Fig. 2.
Comparison of histological staining and gene expression of MF-AT and C-AT. a, d qRT-PCR analysis of gene expression. LPL (a), HOXB7 and bFGF (d) mRNA expression levels were measured in freshly isolated MF-AT and C-AT (*p = 0.01 for HOXB7 and *p = 0.02 for bFGF, unpaired two-tailed Student’s t-test). Error bars, SEM. (b, c, e, f) H&E and Alcian Blue-Nuclear Fast Red staining of freshly isolated C-AT (b) and MF-AT (c) and their respective five-day cultures (e, f). Photomicrographs were acquired using an Axio Imager M2 (Zeiss) with EC Plan APOCHROMAT ×20/0.8 and EC Plan Neofluar ×40/0.75 objectives

