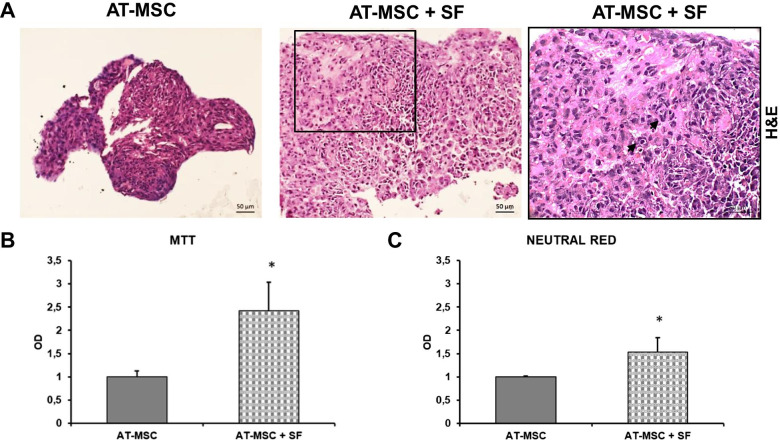
Fig. 6.
H&E staining and proliferative rate of 3D AT-MSC cultures after SF treatment. a H&E staining of 3D AT-MSC cultures 1 day after treatment with SF or maintenance medium. Photomicrographs were acquired using an Axio Imager M2 (Zeiss) with an EC Plan APOCHROMAT ×20/0.8 objective. Arrows (inset): large cytoplasmic cells resembling chondrocytes. b, c Proliferative rates of 2D AT-MSC cultures determined by MTT (b) and Neutral Red (c) assays 1 day after treatment with SF or maintenance medium (*p = 0.01 for both assays, unpaired two-tailed Student’s t-test). Error bars, SD

