Fig. 3.
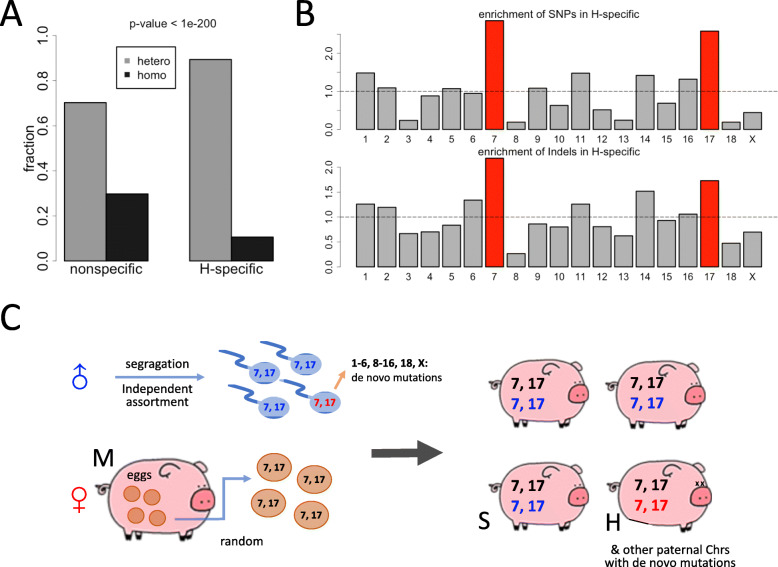
Inference of the independent assortment process during meiosis. (A) “H” denotes the handicapped pig. This barplot showed the fractions of heterozygous/homozygous variations for the H-specific variations and H-nonspecific variations. “H-specific” means appearing in H but not appearing in either M or S. P-value was calculated from Chi-square test. (B) Enrichment of variations in the H-specific group on each chromosome. SNPs and Indels were shown separately. Chromosomes 7 and 17 had the highest enrichment of H-specific variations. As explained in Methods, here the Y-axis is the enrichment = FHi/FNi, 1 ≤ i ≤ 18 or i = chrX. The horizontal line is Y = 1, which indicates equal frequency among H (H-specific mutations) and N (non-specific mutations) (C) The putative independent assortment process inferred from the enrichment of H-specific variations. For sperms, the handicapped pig inherited a specific set of chromosomes 7 and 17 (colored in red), while the normal offspring inherited another set of chromosomes 7 and 17 (colored in blue). For eggs, the combination was random. Apart from the specific mutations inherited from chromosomes 7 and 17, the handicapped pig might also have de novo mutations. The clipart images are made by ourselves

