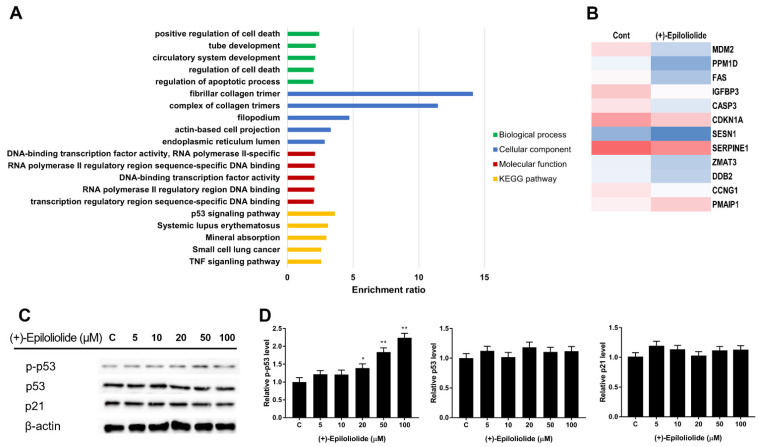
Figure 3.
GO enrichment analysis of proteins specific in (+)-epiloliolide treated BJ-t5a cells. (A) The top 10 enrichment of GO and KEGG pathway of (+)-epiloliolide treatment. (B) Heatmap representation of the expression levels of DEGs associated with p53 signaling pathway. The color gradient from blue to red corresponds to increasing gene expression. (C,D) Cells incubated in GM or medium containing various concentrations of (+)-epiloliolide for 12 h. The levels of p-p53, p53, and p21 were determined using western blotting. Data represent the mean values of at least three independent experiments ± SD. * p < 0.05 and ** p < 0.01 versus the control group.

