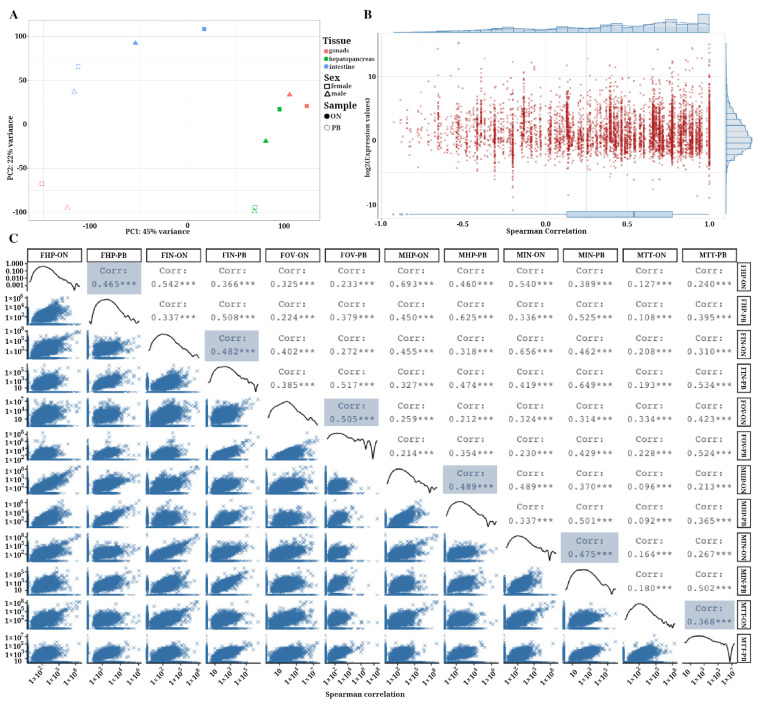
Figure 5.
Correlation of gene expression between samples. (A) Principal component analysis showing the spatial relationship of each of the samples in the study. (B) Spearman correlation analysis using mean of normalized gene expression values in ONT and PacBio samples. The Y axis is showed in Log2 scale. (C) This correlogram shows level of correlation of normalized gene expression values using ONT and PacBio samples. For each sample, the Spearman correlation coefficient of the expression values was calculated (*** p < 0.01).

