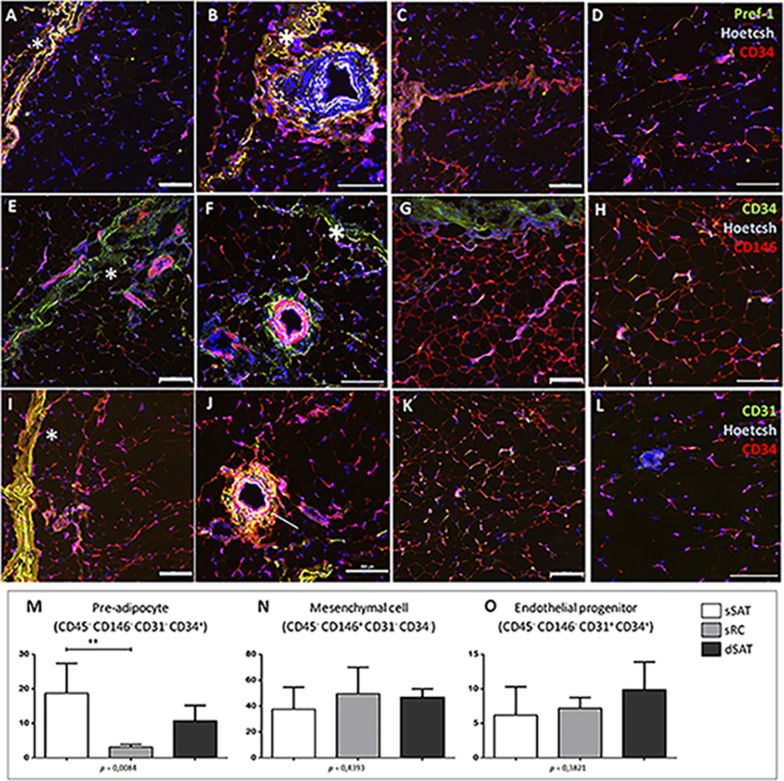
Fig. 2.
Pre-adipocytes are enriched in the sSAT layer. A, B, E, F, I, J Representative images of immunofluorescence of the sSAT microenvironment showing robust blood vessels and the sRC (asterisks). C, D, G, H, K, L Representative images of the dSAT microenvironment. A–D The Pref-1, a late marker for pre-adipocytes, was detected only in the sRC and blood vessels. Representative images showing the presence of the early marker for pre-adipocytes and endothelial progenitor cells CD34 (red in A–D and green in E–H) in the sRC, adipose tissue and blood vessels. E–H CD146, an early marker of mesenchymal stromal/stem cells, is presented at blood vessels and adipose tissue. I–L CD31, a late marker for endothelial cells, can be found associated with blood vessels as expected and to the sRC. J Note the presence of double positive cells (CD34/CD31, arrow). Bar size: 200 μm. Flow cytometric analysis of SVF revealed that the content of pre-adipocytes is higher in sSAT microenvironment compared with sRC (M). M–O The graphs represent the mean ± standard deviation of the percentage of cells analyzed in a total of 100.000 events. ANOVA test evaluated the difference between sSAT, sRC and dSAT. p value is described below each graph. Asterisks indicate p values obtained in the post-test (*p < 0.05). SVF vascular stromal fraction, CD cluster of differentiation, SAT subcutaneous adipose tissue, sSAT subcutaneous adipose tissue, sRC retinaculum cutis, dSAT deep SAT

