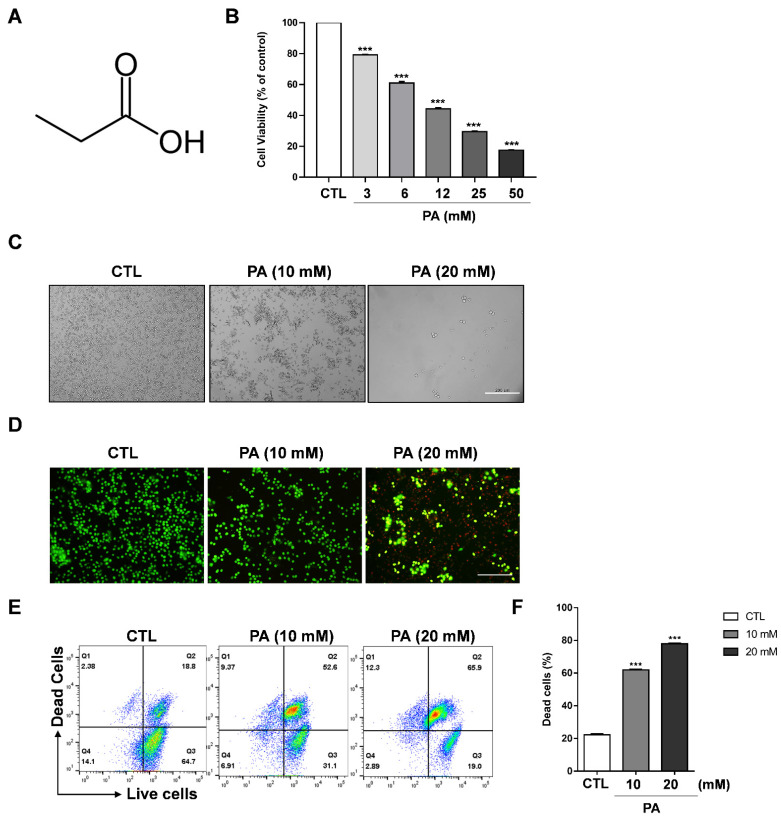
Figure 1.
PA-induced cytotoxic effects on HeLa cells. (A) Structure of propionic acid. (B) Cell viability as measured through MTS assays. HeLa cells were exposed to various concentrations of PA. (C) Cell morphologies taken after 48 h of treatment with PA (scale bar: 200 μm). (D) Live and dead assay performed following PA treatment of HeLa cells. The cells were stained with calcein AM and ethidium homodimer-1 and images were taken using a fluorescent microscope (scale bar: 200 μm). (E) Assessment of the live and dead assay using a flow cytometer. (F) Quantification of dead cells. Values indicate means ± SEM. (n = 3, *** p ≤ 0.001).

