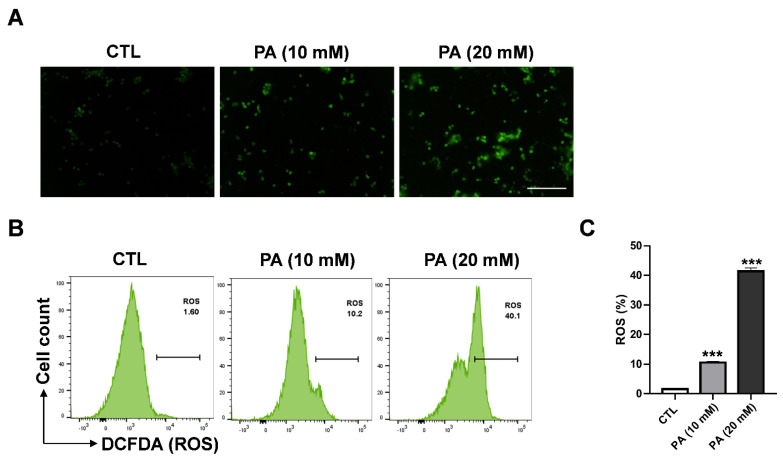
Figure 3.
PA-induced intracellular ROS generation in HeLa cells. (A) PA-induced ROS as observed via fluorescence microscopy (scale bar: 200 μm). (B) Effects of 10 mM and 20 mM of PA for 48 h on ROS levels as measured using DCF-DA and a flow cytometer. (C) Quantification of ROS levels. Values indicate means ± SEM. (n = 3, *** p ≤ 0.001).

