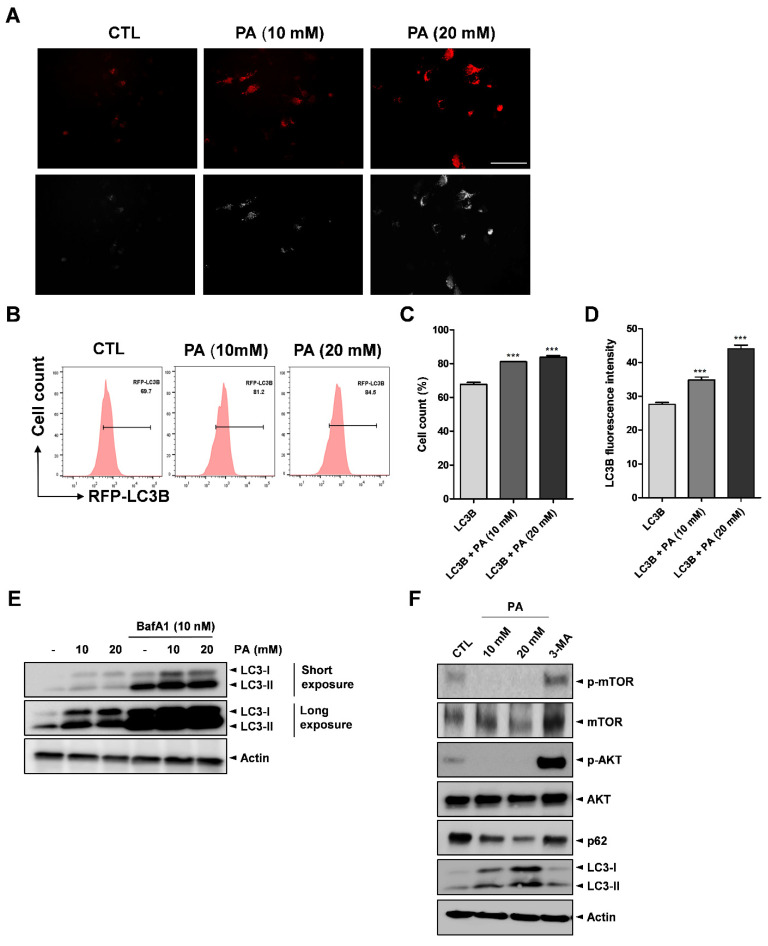
Figure 6.
PA-activated autophagy. RFP-LC3B was transfected into HeLa cell for 16 h then treated with PA for 24 h. (A) Fluorescence microscopy results used to analyze the effects of PA with LC3B puncta (white arrows) formation (scale bar: 200 μm). (B) Effects of 10 mM and 20 mM PA on LC3B puncta formation using RFP-LC3B and RFP as measured using a flow cytometer. (C) Quantification of RFP-LC3B. (D) Quantitative analysis of LC3B median fluorescence intensity. (E) Representative images of immunoblot analysis results of LC3B obtained from autophagy flux assays. The cells were pretreated with 10 nM Bafilomycin A1 (BafA1) for 4 h then treated with PA for 24 h. (F) Expressions of p-mTOR (Ser2448), mTOR, p-AKT (Ser473), AKT, p62, LC3B, and actin as assessed by Western blot analysis. 5 mM of 3-Methyladenine (3-MA) were pretreated for 4 h then treated with PA for 24 h. *** p < 0.001.

