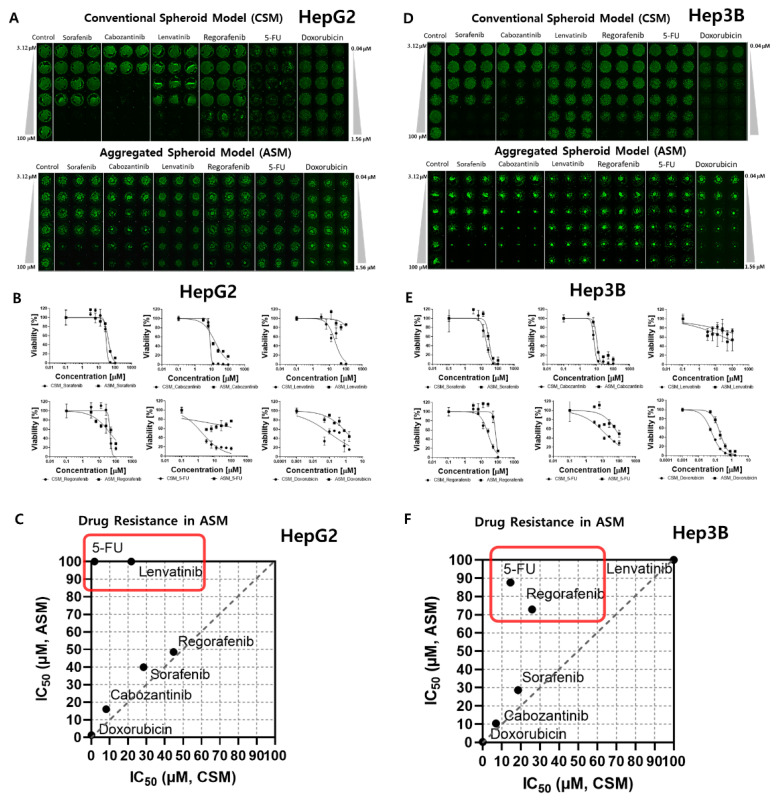
Figure 2.
Comparative dose–response curve analysis of six different drugs in 3D cell models. The IC50 was calculated to compare the 3D live-cell staining dye expression level according to the dose of each of the six drugs. (A) Combined image of 3D live HepG2 cells in the CSM and ASM. (B) Dose–response curves and a summary table of quantitatively analyzed drug efficacy according to the doses of the six drugs tested in the HepG2 CSM and ASM. (C) IC50 comparison of ASM and CSM in HepG2. 5-FU and Lenvatinib showed higher drug resistance in the ASM than CSM. (D) Combined image of 3D live Hep3B cells in the CSM and ASM. (E) Dose–response curves and a summary table of quantitatively analyzed drug efficacy according to the doses of the six drugs tested in the Hep3B CSM and ASM. (F) IC50 comparison of ASM and CSM in Hep3B. 5-FU and Regorafenib showed higher drug resistance in the ASM than CSM.

