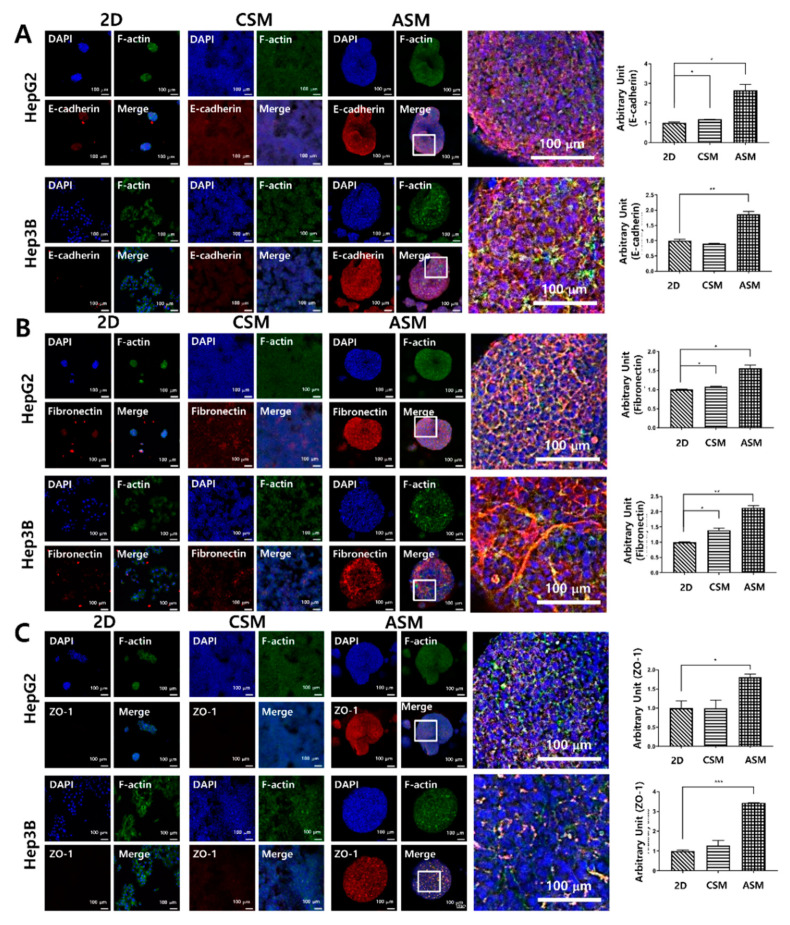
Figure 4.
High-content image analysis of epithelial cancer cell protein and drug penetration-related protein expression. The expression of E-cadherin (A), Fibronectin (B), and ZO-1 (C) increased under ASM culture conditions. Optical sections were acquired at 10 µm intervals and stacked into a Z-projection. Scale bars: 100 µm * p < 0.05, ** p < 0.01, *** p < 0.001.

