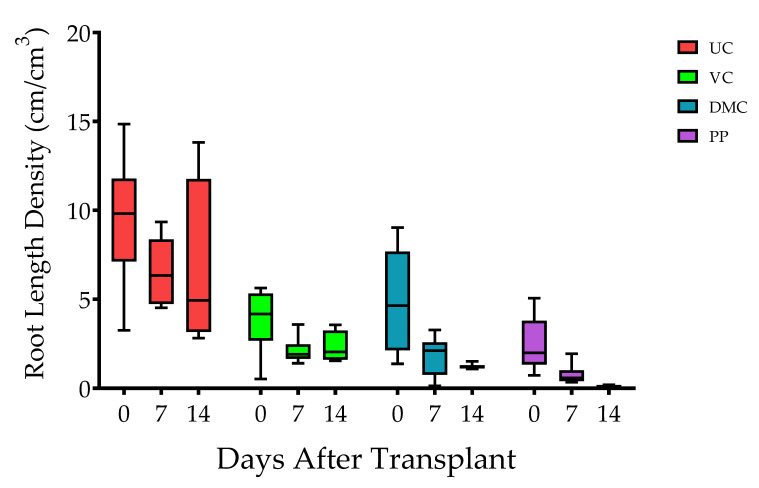
Figure 2.
Box and whisker plot of root length density through time (n = 5). The box represents 25th, 50th (median), and 75th percentiles, and the whiskers represent minimum to maximum values. Error bars represent standard error of the mean. Treatments represent growing mix and soil with amendment of vermicompost (VC, 20% v/v), dairy manure compost (DMC, 20% v/v), or dehydrated poultry manure pellets (PP, 10% v/v) in comparison to an untreated (conventional fertilizer) control (UC).

