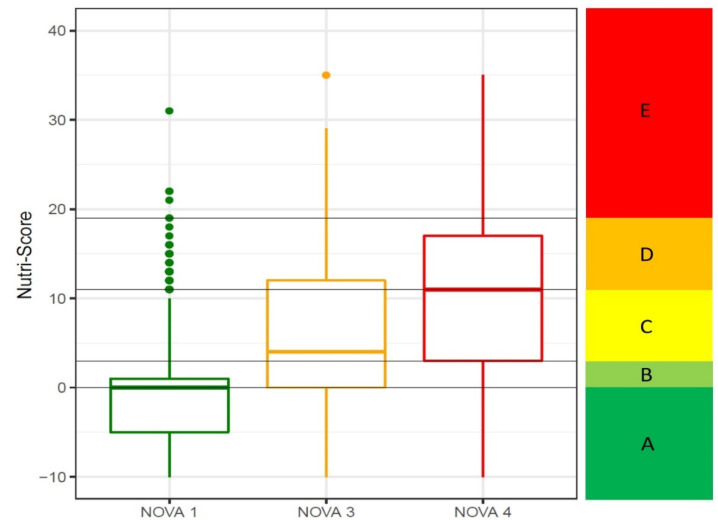
Figure 4.
Boxplot showing the Nutri-Score values according to the different food processing categories (NOVA classification). NOVA 2 is not shown as it only represented 1% of the data. The box boundaries represent the interquartile range (IQR) and the line inside the box shows the median value. The black horizontal lines represent the score boundaries of each of the Nutri-Score categories.

