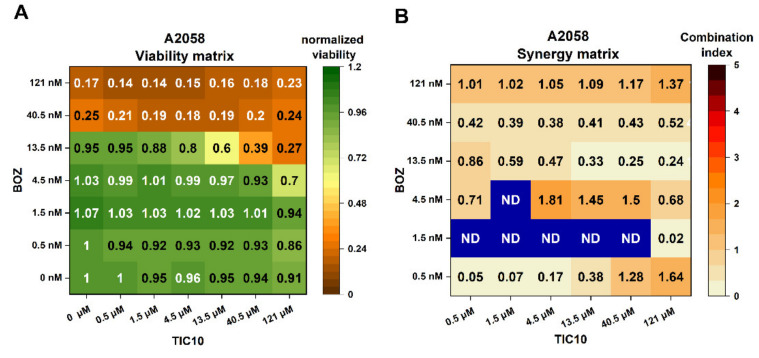
Figure 1.
Heat maps showing antiproliferative effects of bortezomib (BOZ), TIC10 and their combinations on A2058 cells after 72 h of incubation. (A) Normalized viability data are expressed as a ratio of medium control, and (B) combination index heat maps of various drug ratios. Combination index < 1, = 1 or > 1 represents synergism, additive effect or antagonism, respectively. ND: not detectable. Data are presented as mean values (n = 3).

