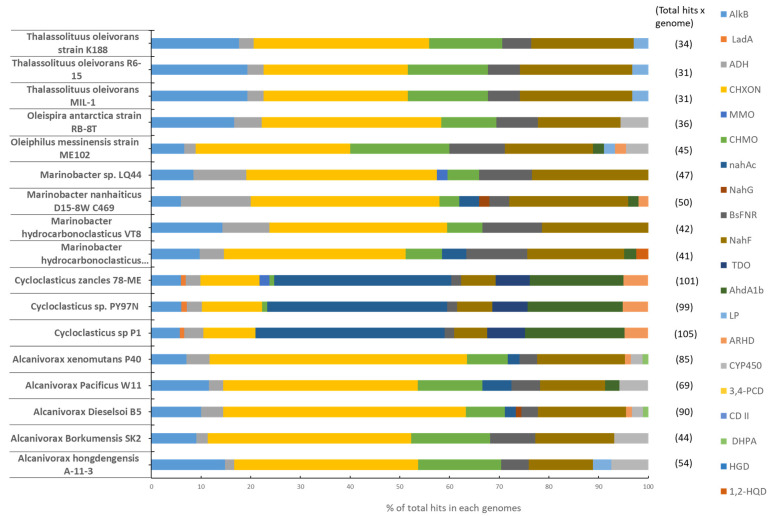
Figure 3.
Relative abundance (expressed as % of the total hits) of genes involved in the degradation of aliphatic and aromatic hydrocarbons within the genomes of hydrocarbonoclastic bacteria. For each bacterial genome, the relative abundance of a single query gene has been calculated as the ratio between the number of genomic hits to that specific query gene, and the total number of genomic hits to all the 20 query genes involved in hydrocarbon degradation. The analysis was conducted using the standalone version of BLAST (Bit-Score > 80; e-Value < 0 e-15; [190]) to document the presence of the genes of interest within the selected genomes. The legend on the right refers, from top to bottom, to (AlkB) alkane hydroxylase, (LadA) alkane monooxygenase LadA, (ADH) alcohol dehydrogenase, (CHXON) cyclohexanol dehydrogenase, (MMO) methane monooxygenase, (CHMO) cyclohexanone monooxygenase, (nahAc) naphthalene dioxygenase, (NahG) salicylate 1-monooxygenase, (BsFNR) ferrodoxin reductase, (NahF) salicylaldehyde dehydrogenase, (TDO) toluene dioxygenase, (AhdA1b) ethylbenzene dioxygenase large subunit, (LP) lipase, (ARHD) aromatic ring-hydroxylating dioxygenase subunit alpha, (CYP450) cytochrome P450, (3,4-PCD) protocatechuate 3,4-dioxygenase, (CD II) catechol 1,2 dioxygenase, (DHPA) 3,4-dihydroxyphenylacetate 2,3-dioxygenase, (HGD) homogentisate 1,2-dioxygenase and (1,2- HQD) hydroxyquinol 1,2-dioxygenase.

