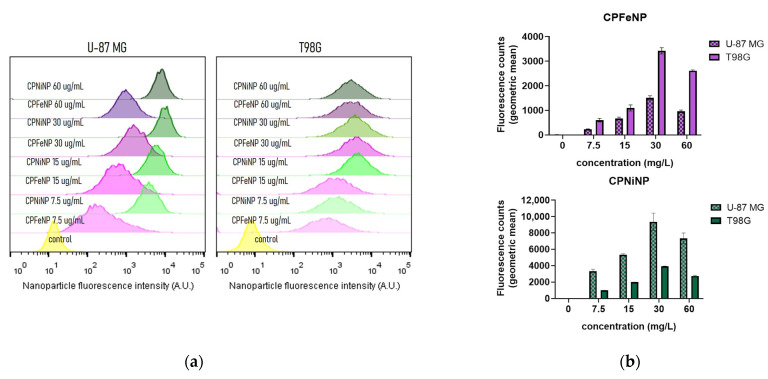
Figure 2.
IONP-doped CPN cell uptake quantification by flow cytometry. (a) Cell fluorescence histograms obtained from U-87 MG and T98G GBM cell lines after 24 h nanoparticle incubation time. (b) Bar graphs representing semi quantification (geometric mean fluorescence intensity) of cell fluorescence (associated with particle uptake) at varying particle concentrations for CPFeNP (upper panel) and CPNiNP (lower panel) respectively.

