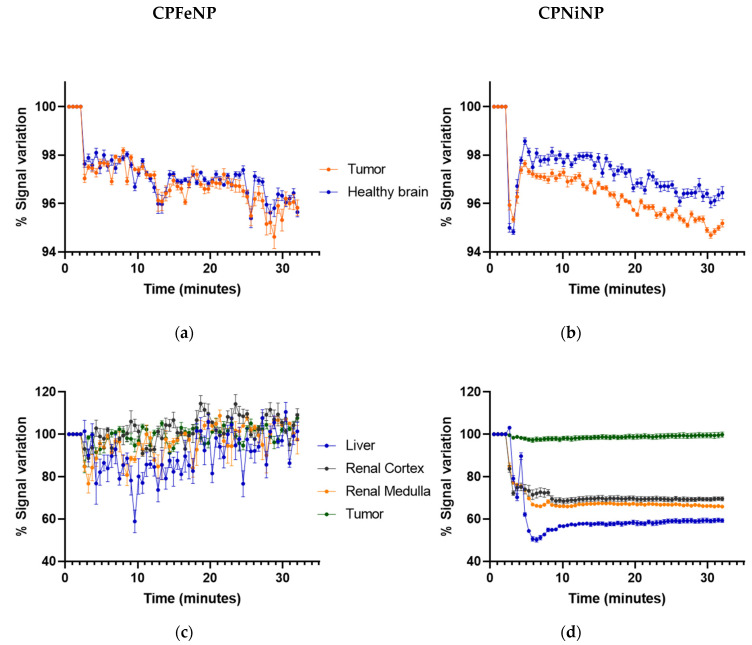
Figure 4.
Biodistribution MRI studies of ION-doped CPNs. Graphics show the variation in MRI signal intensity (mean ± SEM) in the different organs evaluated: tumor and contralateral healthy brain in the orthotopic glioma model for CPFeNP (a) and CPNiNP (b); and liver, renal cortex, renal medulla and tumor in the heterotopic GBM model for CPFeNP (c) and CPNiNP (d).

