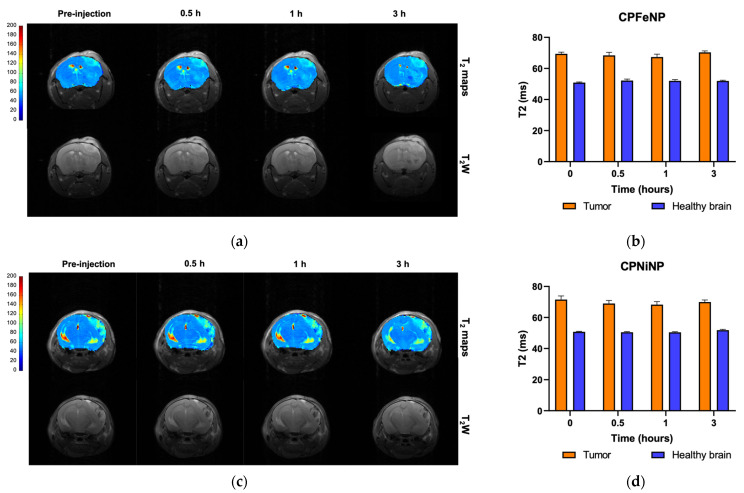
Figure 5.
T2 color-code based maps and T2W images of orthotopic GBM model. Data were acquired before the i.v. administration of the IONP-doped CPNs, and at 0.5, 1 and 3 h after the injection. MRI evaluation of CPFeNP (a) and CPNiNP (c). Graphical bar showing the variation in T2 values (mean ± SEM) along the temporal evaluation of CPFeNP (b) and CPNiNP (d).

