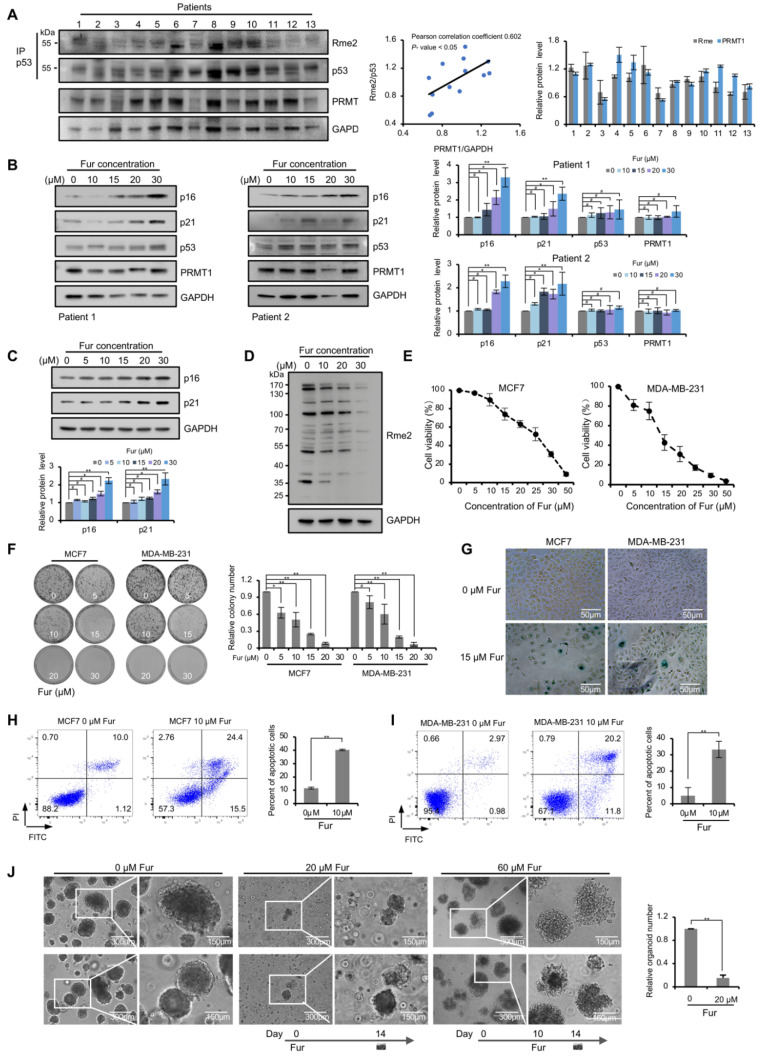
Figure 5.
p53 response and cellular phenotypes in PRMT1 inhibitor-treated breast cancer cells. (A) Western blotting assays showing the arginine methylation levels of p53 precipitated with anti-p53 antibody from 13 breast cancer tissues (top). PRMT1 and GAPDH levels in 13 breast cancer tissues (bottom). PRMT1 expression levels were normalized by GAPDH. The arginine methylation levels were normalized by p53. The correlation analysis of Rme2 and PRMT1 protein levels presented in the middle (p < 0.05). Quantification shown on the right. Data were presented as mean ± SD. (B) The levels of indicated proteins were analyzed by Western blotting in primary breast cancer cells treated for 72 h with Fur (0, 10, 15, 20 and 30 μM). Quantification shown on the right. Data were presented as mean ± SD from three independent experiments. (C) The levels of indicated proteins were analyzed by Western blotting in MCF7 cells treated for 72 h with Fur (0, 5, 10, 15, 20 and 30 μM). Quantification shown on the bottom. Data were presented as mean ± SD from three independent experiments. (D) Whole cell lysates from MCF7 cells treated for 24 h with Fur were immunoblotted with anti-Rme2 antibody. (E) The viability of MCF7 and MDA-MB-231 cells treated with Fur for 72 h was detected through CCK-8 assays. Data were presented as mean ± SD from n = 3 independent experiments. (F) Colony formation assays shown in MCF7 and MDA-MB-231 cells treated with Fur for 12 days. Quantification shown on the right. Data were presented as mean ± SD from three independent experiments. (G) SA-β-gal staining of MCF7 and MDA-MB-231 cells treated with Fur for 48 h. (H,I) Flow cytometry analysis of the intensity of annexin V-FITC/PI staining in MCF7 (H) and MDA-MB-231 cells (I) treated with Fur (10 μM) for 48 h. Annexin V (+)/PI (+/−) populations (%) were regarded as apoptosis. Quantification shown on the right. Data were presented as mean ± SD from three independent experiments. (J) Organoid formation ability of primary breast cancer cells treated with Fur. In the middle panel, cells were treated with 20 μM Fur at day 0. In the right panel, cells were treated with 60 μM Fur at day 10. Quantification shown on the right. Data were presented as mean ± SD from n = 3 independent experiments. Fur: Furamidine dihydrochloride. #, p > 0.05; *, p < 0.05; **, p < 0.01.

