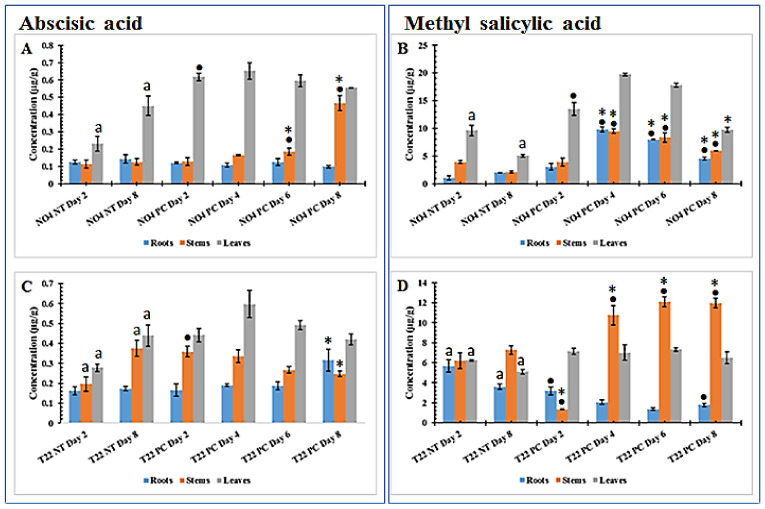
Figure 3.
Changes in abscisic acid (A,C) and methyl salicylic acid (B,D) in PGPR-primed tomato plant tissues harvested at different time points following Phytophthora capsici inoculation. (A,B) Pseudomonas fluorescens N04 primed-unchallenged (NT) vs. primed-challenged (PC), (C,D) Paenibacillus alvei T22-primed-unchallenged vs. primed-challenged. All concentrations are expressed as µg/g fresh weight (FW). An asterisk (*) or a dot (•) or letter (a) indicates the statistical significance (ANOVA followed by Tukey post-hoc test) with a p-value < 0.05 (Table S5), comparing the PGPR-primed-unchallenged plants and the primed-infected plants. • indicates a comparison between NT day 2 and the primed-challenged plants on days 2–8 and * indicates a comparison between NT day 8 and the primed-challenged plants on days 2–8. The letter “a” indicates a statistically significant difference between the NT controls on days 2 and 8. One-way ANOVA comparing mean values of quantified phytohormones in PGPR-primed-unchallenged vs. PGPR-primed-challenged tomato plant tissues is presented in Table S1.

