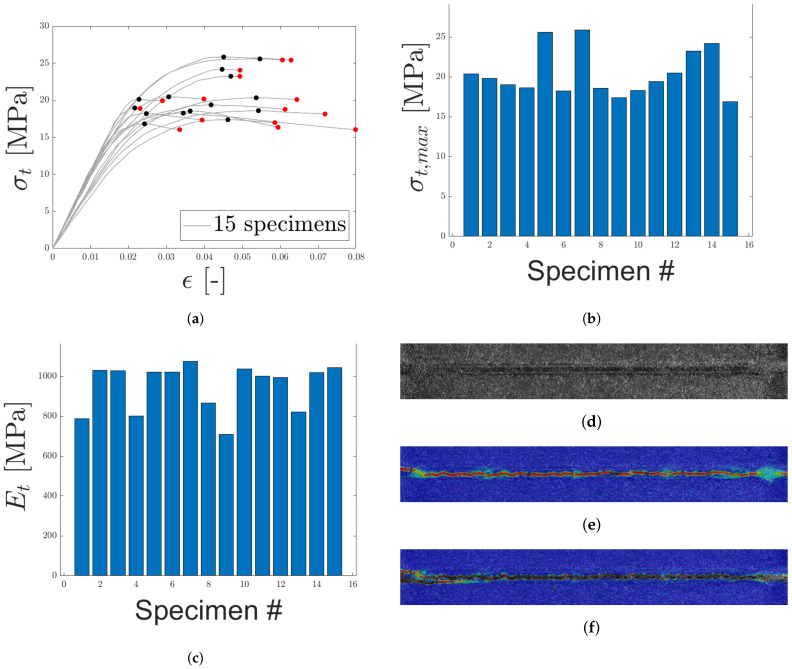
Figure 11.
The uniaxial, engineering stress-strain response for LC 1 is presented in (a) with maximum stress and fracture marked by black and red, respectively. In (b,c), maximum uniaxial stress and equivalent Young’s modulus are presented, respectively. (d) contains the speckle pattern for one of the specimens. In (e,f), the strain field along the loading direction (before and after fracture), obtained using DIC, is presented.

