Figure 3.
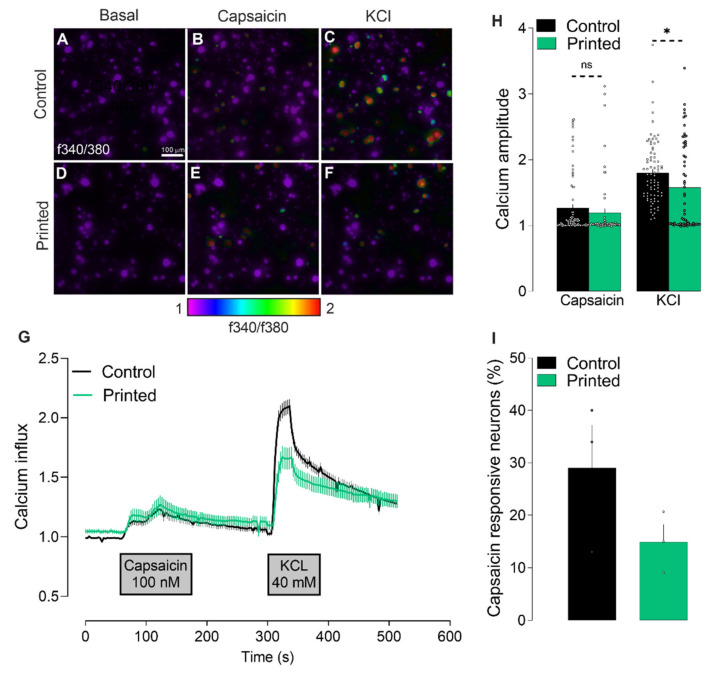
Effects of the printing process on calcium influx triggered by capsaicin. Calcium flux (A–F, showed as heatmap of f340/f380; (G), showed as time–response curve of f340/f380) in cultured (A–C) and printed (D–F) DRG neurons after exposure to vehicle (A,D), capsaicin (100 nM; B,E) and KCl (40 mM; C,F). The maximum amplitude of response evoked by capsaicin and KCl (H). Percentage of capsaicin-responsive neurons (I). Results consist of the means ± S.E.M. Two-tailed unpaired Student t-test. Significant differences are indicated by asterisks (p < 0.05 = *; ns: not significant as p > 0.05). Amplitude represents the point in which the change in the ratio f340/f380 is maximal. Scale bar = 100 µM (A–F).

